Inflation Isn't Getting Better. Yet.
Consumer prices rose rapidly in June. But many of the forces blamed for inflation are moving in the other direction.
U.S. consumer prices in June were 1.32% higher than in May on a seasonally-adjusted basis. That’s the largest one-month increase since Hurricane Katrina temporarily knocked out oil refining capacity across the gulf coast back in 2005. Unlike back then, the latest numbers are part of a disturbing pattern of excessive monthly price gains. The Consumer Price Index (CPI) has grown at an average yearly rate of 11% in 2022 so far, which is even worse than 8% average yearly rate in March-December 2021.
This is bad, but policymakers should be wary of overreacting to numbers that only describe what has already happened. What matters is what happens next—and there the signals are less clear.
The worst news is that the prices that have historically tended to be most sensitive to domestic economic conditions and that best reflect underlying inflationary pressures are showing no signs of slowing down.
Meanwhile, the disruptions that have been responsible for so much of the inflation we have experienced so far could easily become even more disruptive in the months ahead. As one pseudonymous commentator put it, what the Russian government does after Gazprom’s regularly scheduled maintenance of the Nord Stream 1 pipeline is supposed to end on July 22 matters more for U.S. (and global) inflation than what the Federal Reserve decides to do at their next scheduled meeting on July 26-27. And the Chinese regime’s ongoing willingness to impose draconian lockdowns to stop the spread of the coronavirus remains a wildcard that could wreak havoc on manufacturing and shipping, even if it may also put downward pressure on energy prices.
But there is also some good news. Many prices that had surged earlier in the pandemic have either stopped rising, or are falling outright. (The price of “laundry equipment” is down by 4% since the peak in March.) And the indicators that some analysts pointed to in 2020 and early 2021 as harbingers of the inflation we see today are now implying that the current price spike may already be on its way out. Wages, commodity prices, the money supply, and the federal budget deficit all look radically different now than they did even a few months ago. Trillions of dollars of stocks, crypto, and home equity can no longer be monetized. This may not be sufficient to bring inflation back into line, but it is encouraging.
I have explained my thinking about the causes of inflation, both in general and in the the past few years specifically, at length in previous notes—most recently here and here. So the rest of this note is an update of the specific topics I find most helpful for understanding what is happening now, mostly with charts rather than text.
What Happened in June?
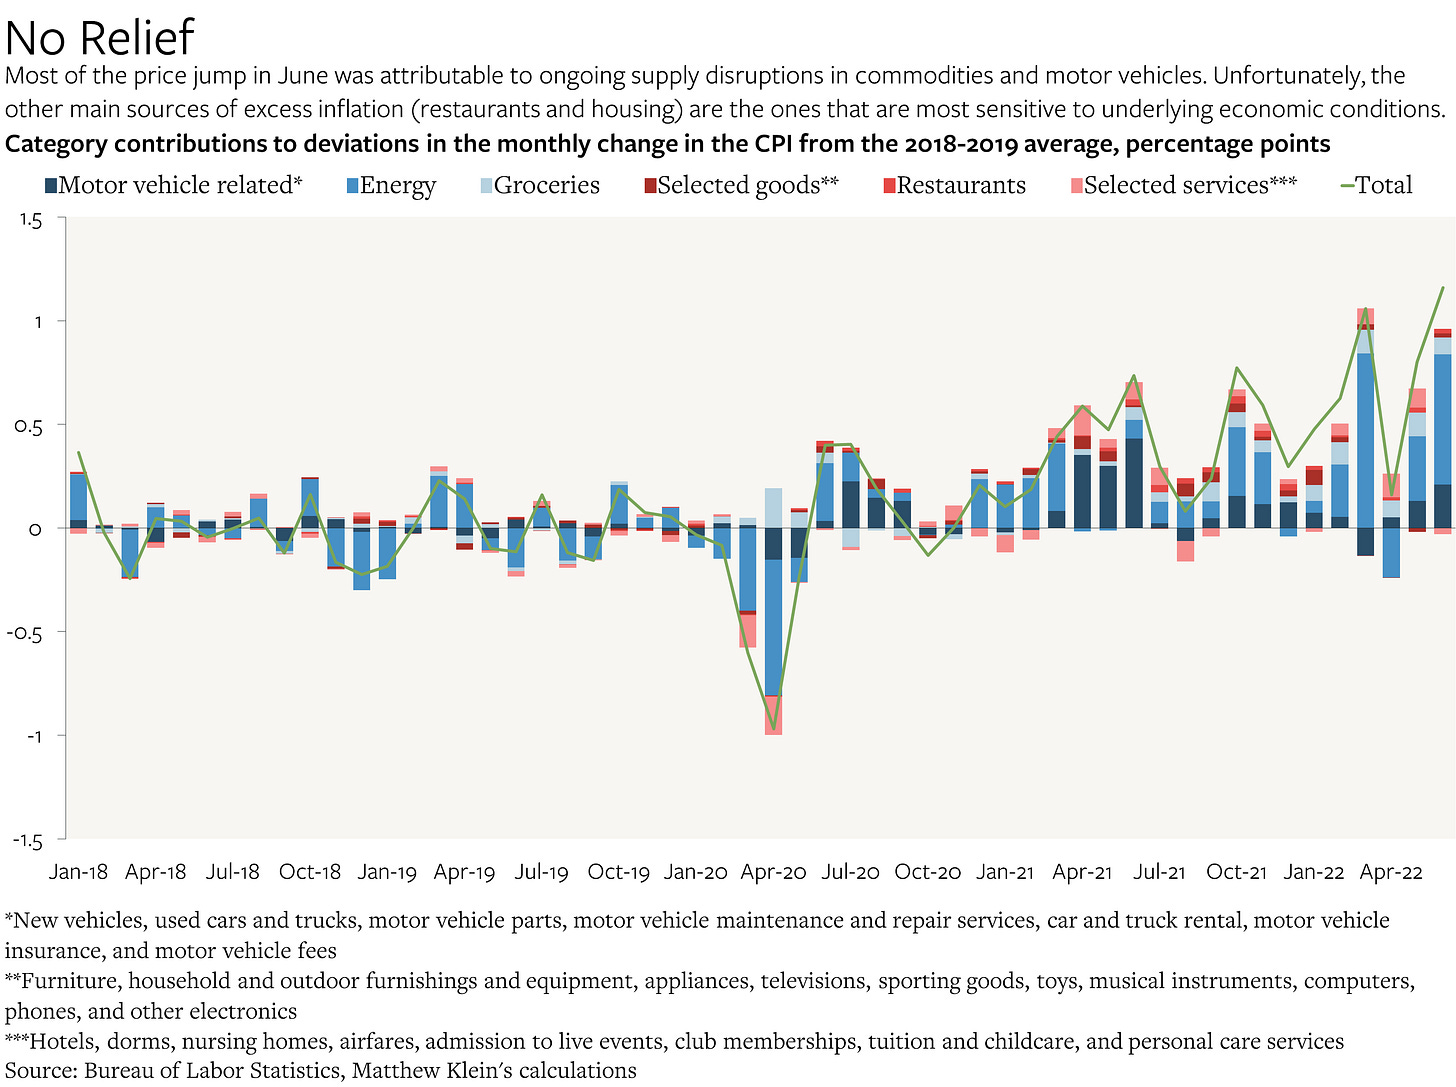
The consumption-weighted average price of goods and services bought directly by Americans jumped by 1.32% in June on a seasonally-adjusted basis. Of that, 0.64 percentage points were attributable to higher energy prices (mostly gasoline but also electricity and piped gas), while another 0.22 percentage points were attributable to rising prices for motor vehicle goods and services. In other words, two-thirds of the total CPI increase—and about 72% of the excessive inflation relative to the pre-pandemic trends of each component—was attributable to two categories that have suffered from extreme supply disruptions since the start of the pandemic and that have a total index weight of just 22%.
But even if we strip out energy and motor vehicles from the analysis, we would still have had almost 0.5 percentage points of inflation in June, or about 6% annualized. While some of that remainder has its own idiosyncratic explanations—the surge in “cereals and bakery products” is at least partly attributable to the war, for example—most of the remaining excess inflation is attributable to categories that best reflect underlying domestic economic conditions: restaurants and rents.


