
Yes, Living Standards Have Grown Slower in Northwest Europe than in the U.S.
But what that means for relative income levels is much less clear.

The point of working1 is to produce enough value for the rest of society to be able to consume as many goods and services as we want for at least as long as we are alive.2 “Progress” is when people can buy more/better goods and services for a given amount of work. Some might choose to work less than others if they have fewer material desires3, but even those who work extremely hard may have trouble earning enough to cover their expenses if nobody else values their output highly enough. So it can be a sensitive subject when one society seems to be enjoying far less progress than another that it considers to be a rough peer.
This explains the months-long debate about the appropriate way to compare incomes in the U.S. vs. Europe. It began in February with an intriguing entry from Seth Ackerman and recently picked up again thanks to interventions by, among others, Paul Krugman, Luis Garicano, Philippe Aghion, Antonin Bergeaud, Brad Delong, Martin Sandbu, and Robert Inklaar.4
It all comes down to this chart:
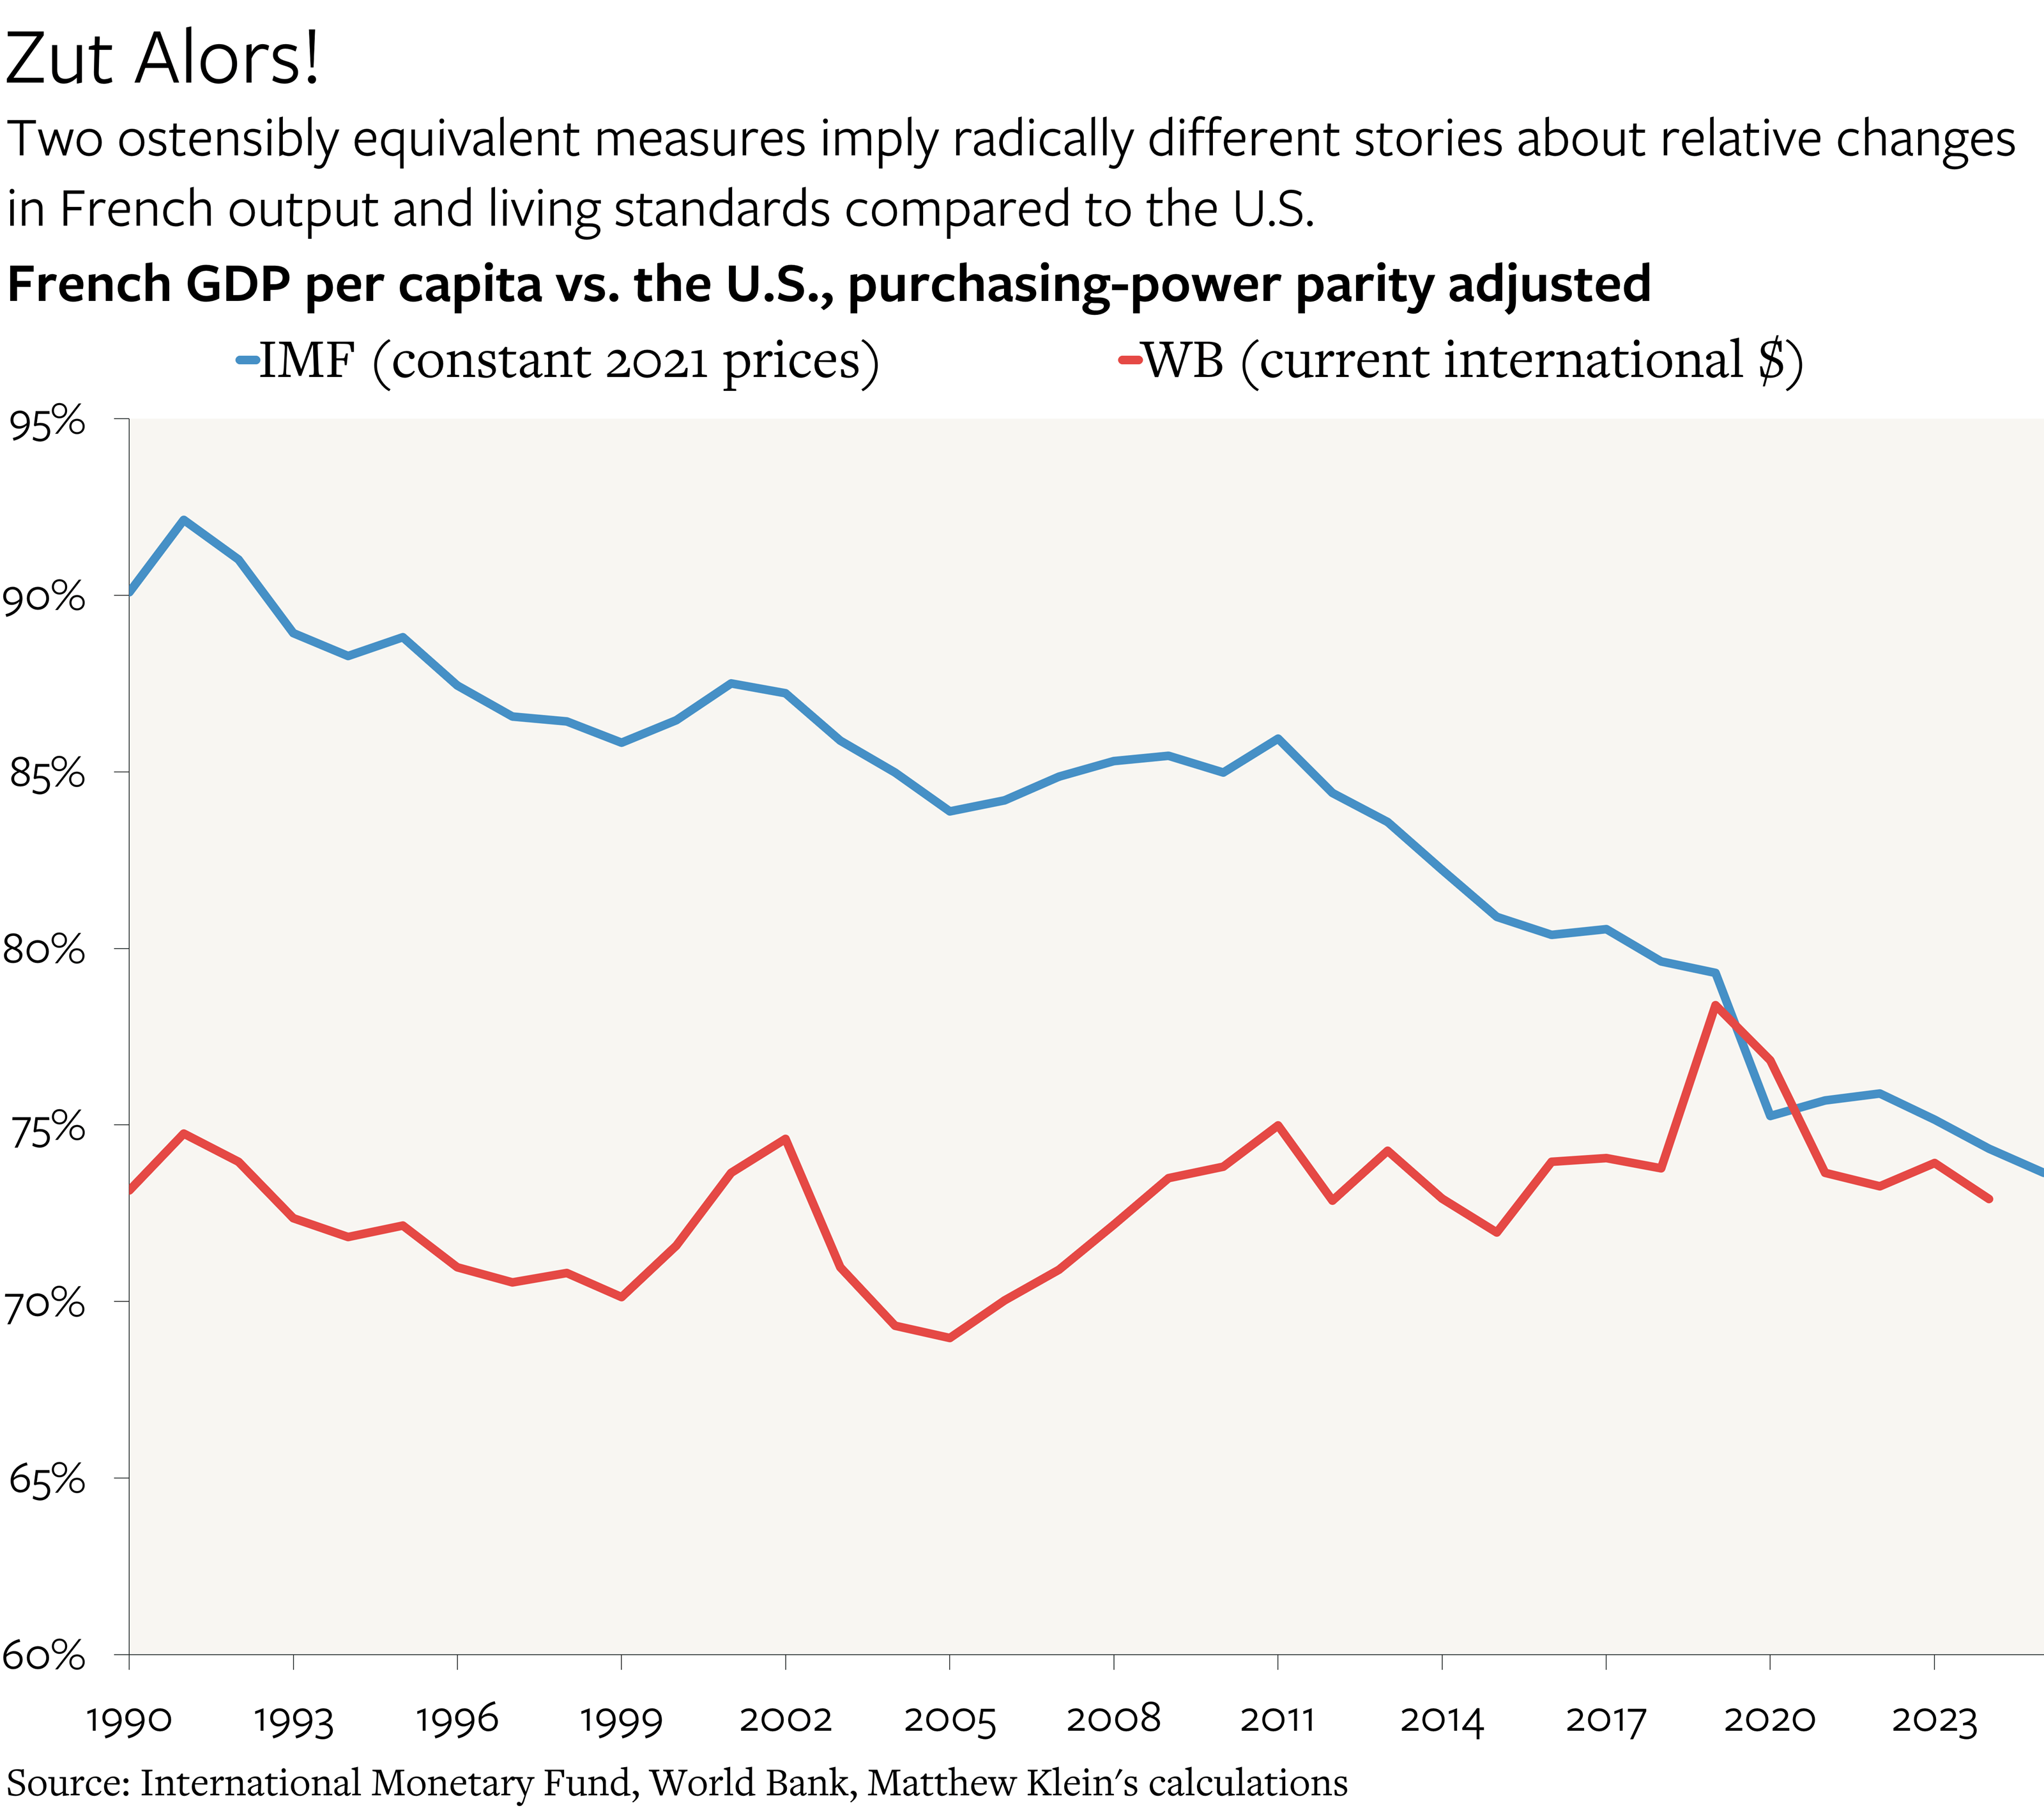
One side argues, using standard methods (blue line above), that people in (most of) the rich European countries5 have been losing ground to Americans since the mid-1990s, but especially since the euro crisis and again since the pandemic. Aside from being supported by most of the public-sector data, it is also consistent with the relative performance of U.S. vs. European stock markets over the past few decades, as well as current valuation differentials.
The other side points out that unconventional methods (red line above) imply that there has been little change in the relative standing of the U.S. and northwestern Europe. In their view, the real value of what Europeans produce has grown more slowly than what Americans produce in large part because the prices of American-made technology goods and services have plunged. European productivity can rise more slowly than U.S. productivity without affecting Europeans’ relative living standards, according to them, because regardless of who is producing more, European and American consumers can both enjoy the extra supply and lower prices.
Measuring changes in the “real” value of economic activity is always fraught, and doing so while engaging in cross-country comparisons multiplies the difficulties. While I appreciate a counterintuitive finding at least as much as the next person, the most straightforward interpretation of the available data is that material living standards in the richest European countries have indeed been rising more slowly than in the U.S.
Perils of Purchasing Power Parities
In 2024, the average American worker was paid about $78,000 in wages and salaries before taxes. (Total gross compensation was substantially higher after accounting for benefits.) In that same year, the average Danish worker was paid about 457,000 Danish kroner, or about $65,000 at prevailing exchange rates before taxes. The average Irish worker was paid about €55,000 before taxes, or about $59,000 at 2024 exchange rates. The average worker in the Duchy of Luxembourg was paid about as much as the average American worker before taxes, at market exchange rates, while Swiss workers were paid substantially more. Workers in the rest of Europe were paid less. Since average taxes in most of Europe, particularly in Denmark (but not in Switzerland), are far higher than in the U.S., the gap in take-home pay was even larger.
These comparisons are misleading for several reasons. For one thing, higher taxes roughly correspond to higher government spending, which means that much of the foregone income is more or less recouped over the course of a typical worker’s lifetime.6 For another, price levels vary across countries. The median 1-bedroom in central Copenhagen costs about $2000/month and is around 550 square feet, or about $3.6 per square foot per month. By contrast, the median 1-bedroom in Manhattan is about $5000/month for 710 square feet (~$7/sqft/month) while median 1-bedroom rents in the roughly equivalent parts of Boston and San Francisco are about $5-$6 sqft/month. Similarly, a decent glass of wine at a typical restaurant or wine bar in Copenhagen costs about 100 DKK ($15) including taxes and service, compared to well over $20 in many U.S. cities.7
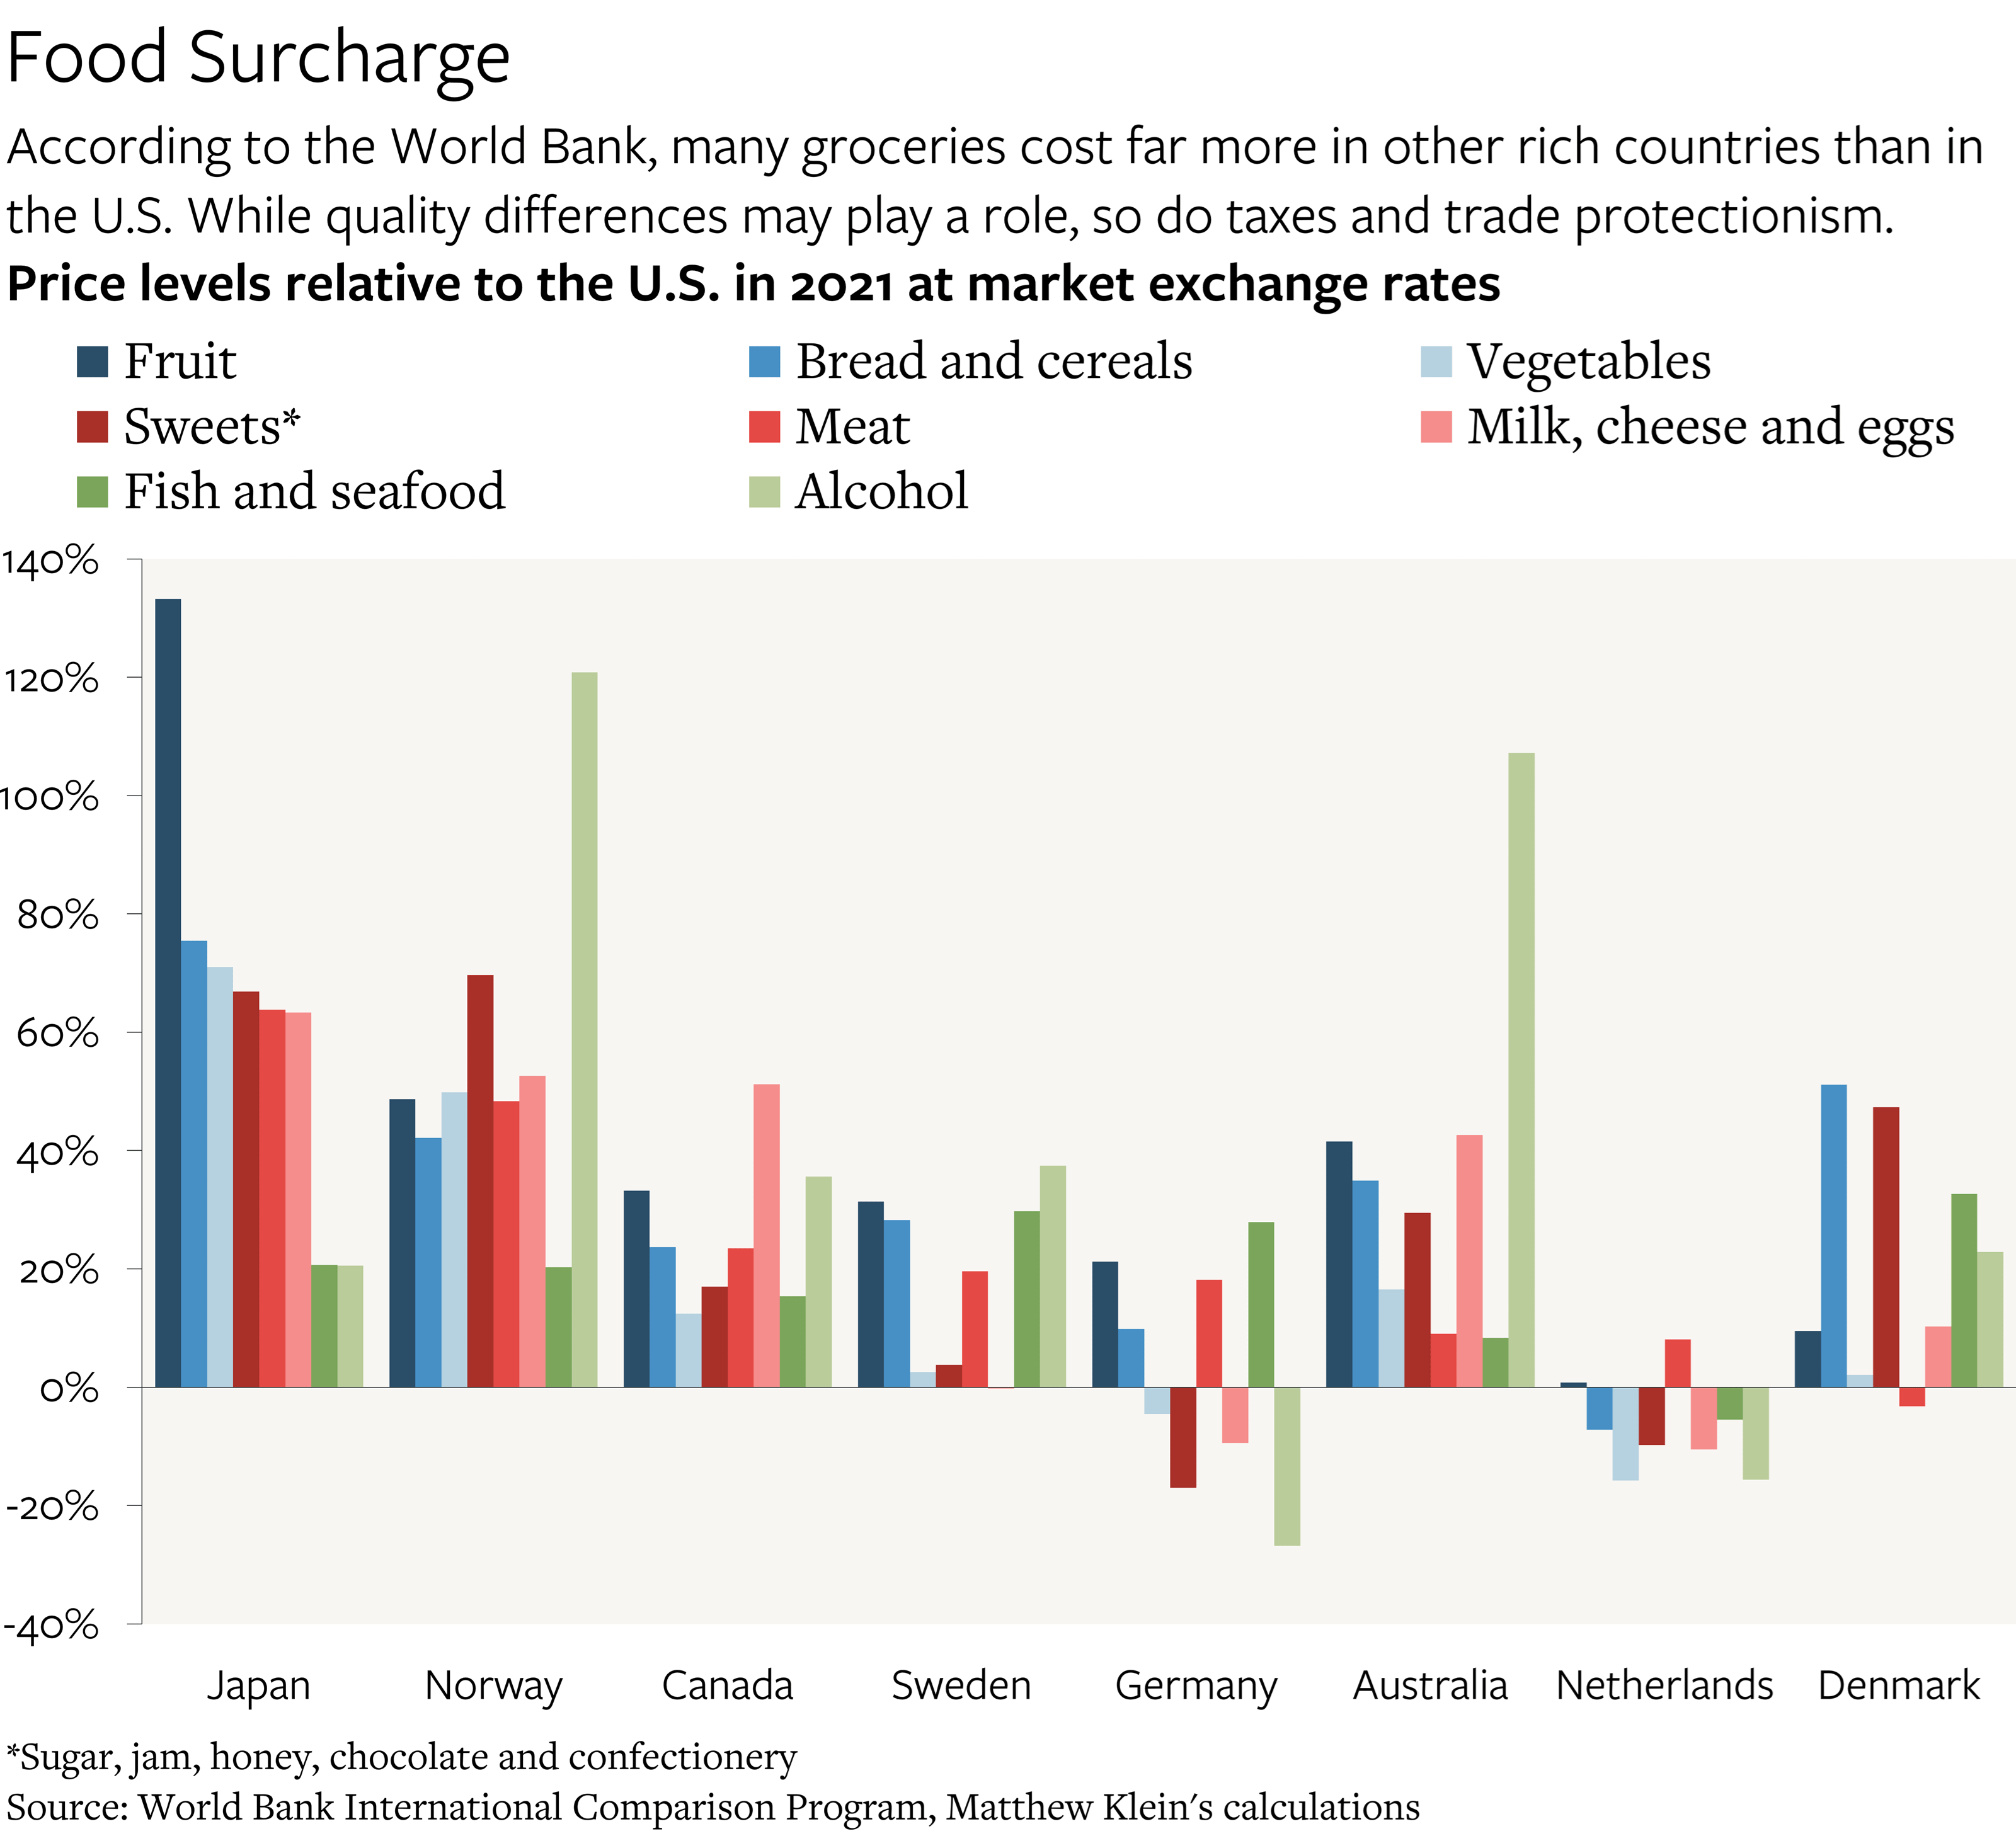
Economists are aware of these issues. Instead of comparing pre-tax wages per person, they prefer comparing total national income per hour worked, and instead of simply using market exchange rates, they attempt to adjust for differences in price levels across countries using Purchasing Power Parities (PPPs). At any given point in time, the prices of more or less equivalent goods and services can be compared across countries to provide adjustments that are more rigorous than simply using market exchange rates.
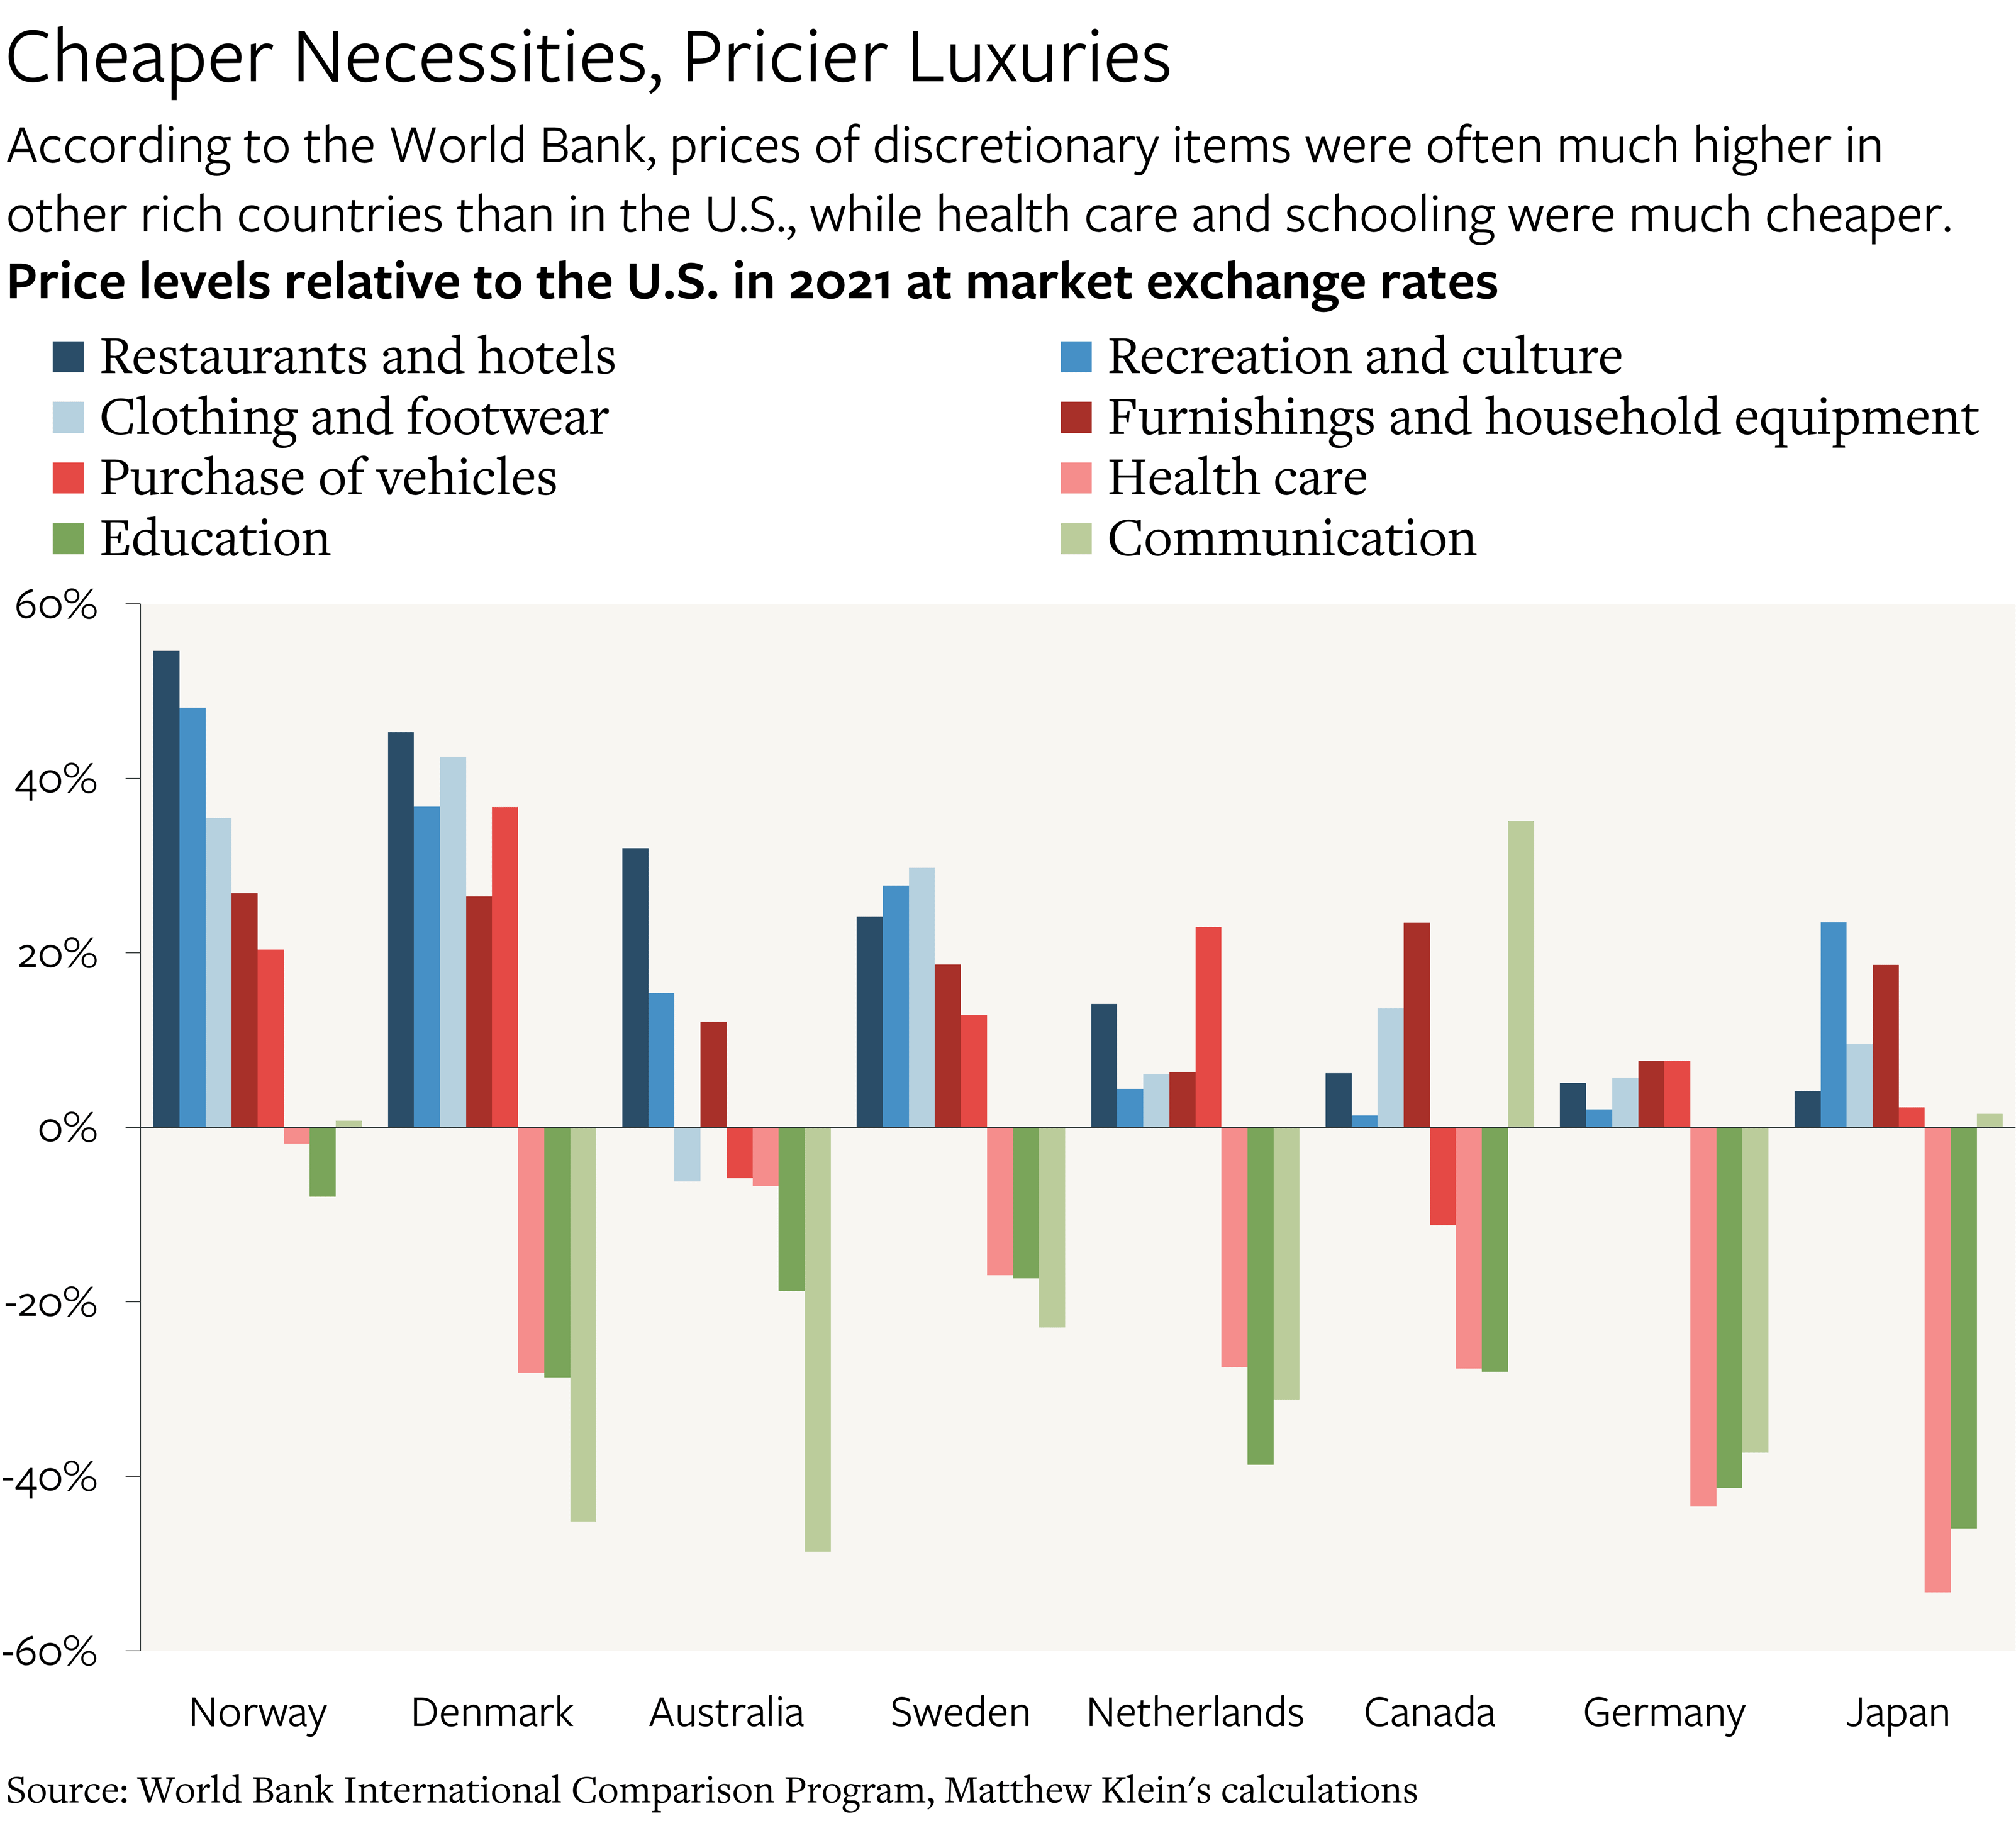
The International Comparison Program (ICP) tries to do this for almost every country in the world across a range of goods and services, with a particular focus on food. According to the ICP, overall consumer prices at prevailing market exchange rates were about 8% higher in Denmark than in the U.S. in 2021, the latest year for which we have detailed data. Restaurant prices were about 45% higher than in the U.S. while the prices of health care and education (including government benefits provided directly) were about 28% lower. Similar patterns can be found in other rich countries, although there is still plenty of variation.
This is all well and good for comparing prices and incomes at points in time, but what about across time?