America's Inflation Story Is Entering a New Phase
Idiosyncratic price spikes due to reopening and troubles in the motor vehicle supply chain are fading or reversing. But keep an eye on housing, health care, and restaurants.
The temporary inflation spike associated with America’s reopening seems to have ended—or even partly reversed. The question now is what happens to the much larger categories that have helped hold inflation down thus far.
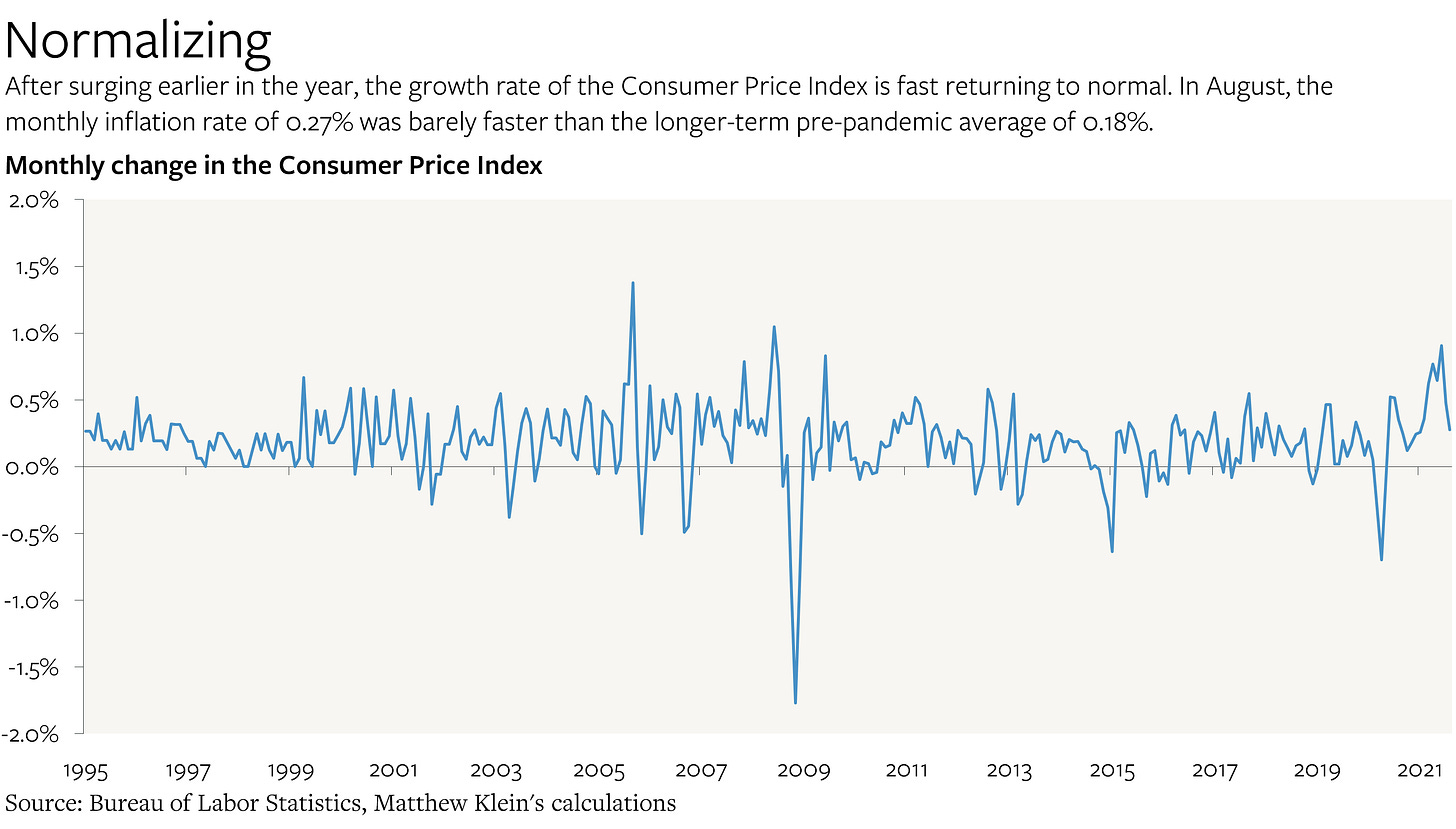
The Consumer Price Index was 0.27% higher in August than in July on a seasonally-adjusted basis. That’s the smallest monthly increase since January 2021 (0.26%), and not far off from the January 1995-February 2020 monthly average of 0.18%. In April-June 2021, prices were rising about 0.8% each month, or a yearly rate of nearly 10%.
The deceleration was caused by sharp declines in the prices of used cars and trucks (down 1.5% in August compared to July on a seasonally-adjusted basis), hotels and motels (down 3.3%), airfares (down 9.1%), motor vehicle insurance (down 2.8%), car and truck rental (down 8.5%), and “admission to movies, theaters, and concerts” (down 0.6%).
These price declines likely reflect a combination of
Easing strains on the motor vehicle supply chain due to the satiation of consumer and rental fleet demand
The impact of the delta variant on consumer demand for certain services
The possibility that some hotels, airlines, and car rental agencies increased prices too much over the summer in the expectation of a snapback of price-insensitive business travel, and are now reversing course
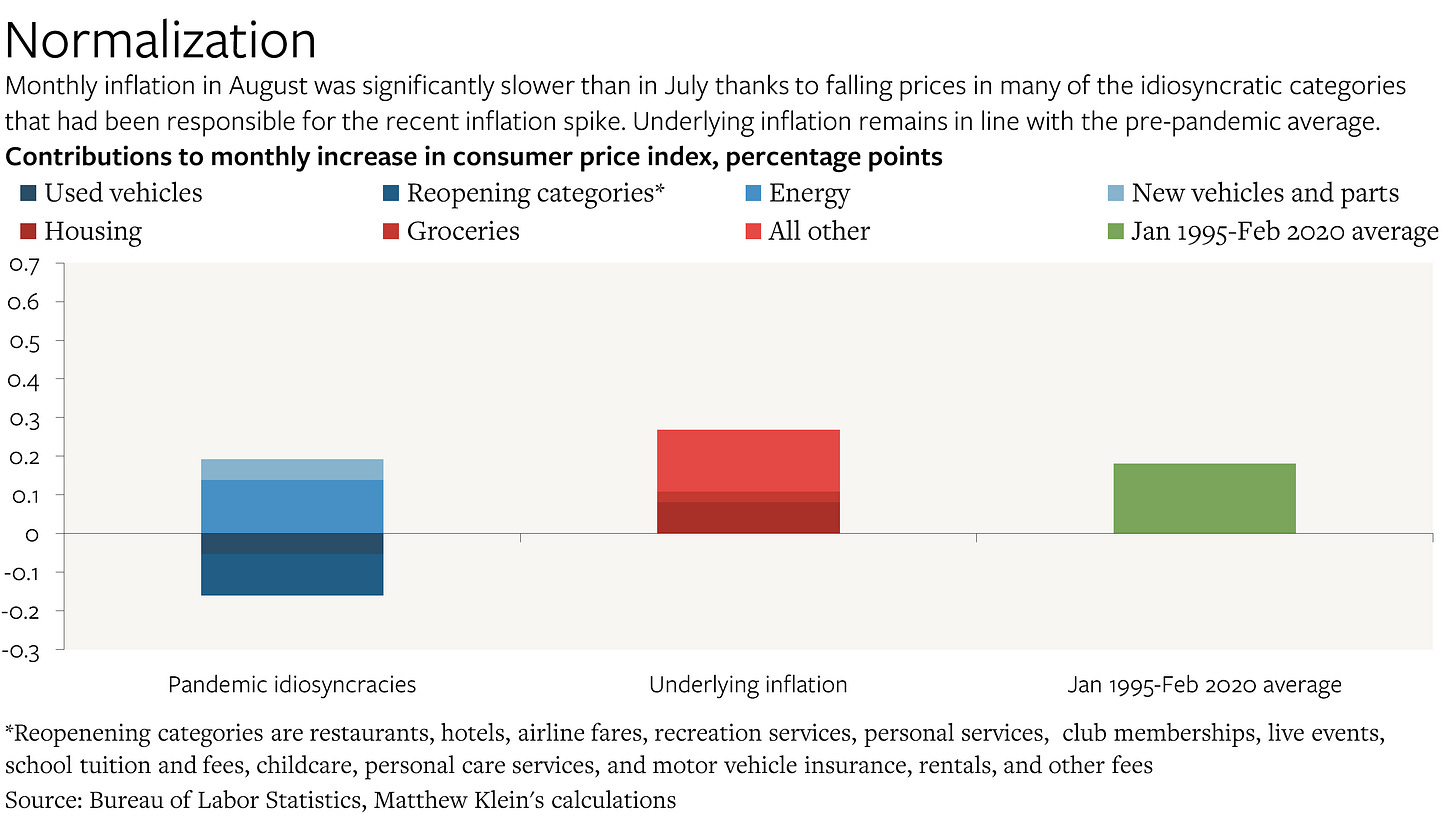
Even adding in other pandemic-sensitive categories that didn’t experience falling prices—personal care services, admissions to sporting events, club memberships, childcare/tuition, and, most notably, energy, restaurants, and new vehicles—the net inflationary impact of these idiosyncratic categories was essentially zero in August.
While those idiosyncratic categories (the blue column) collectively represent less than 30% of the total Consumer Price Index, they were responsible for almost the entire inflation spike in the spring, contributing 0.7 percentage points to the monthly inflation rate in June and 0.3 percentage points to inflation in July.
This is how things have evolved since the start of the year.
Throughout this period, contributions to monthly inflation from the vast majority of the Consumer Price Index (the sum of the red columns) have been broadly stable, averaging 0.2 percentage points since the start of 2021. Here’s a simplified view of the last chart, with all the blue and red columns consolidated.
The reversal of pandemic-era idiosyncracies could potentially drag down the broader inflation even more in the next year or so.
Past experience suggests that used vehicle prices can easily fall back to where they were, if not even lower. Prices fell more than 10% from the end of 2013 through the beginning of 2017, by more than 18% from the beginning of 2001 and the end of 2003, and by 7% from the beginning of 1995 through the end of 1997. Consumer demand was relatively robust in all of those cases.
More recently, we’ve been seeing a spike in the prices of new vehicles thanks to the ongoing shortage of critical microprocessors. But this could easily reverse once the chipmakers and the automakers adapt. Quality-adjusted prices of new vehicles fell by 5% in 1997-2005, after all, and that decline hadn’t even been preceded by an acute shortage.
So what is there to worry about?
Focusing just on the underlying inflation indicators, the biggest change so far has been the acceleration of housing inflation as measured by actual and imputed rents.
But this isn’t a sign of trouble, at least not yet. In the years before the pandemic, rents rose about 3-4% a year, which was broadly in line with the most comprehensive measures of worker pay. During the pandemic, rental inflation slowed sharply, with rents in some major cities falling outright. That reflected economic weakness, pandemic-induced migration, and the imposition of temporary government policies.
The good news is that things are returning to normal, with rents once again rising at the healthy yearly rate of about 3-4% since April.
It’s possible—in fact, it’s a good bet—that rent growth continues to accelerate so that rents converge to where they would have been in the absence of the pandemic. In practice, that might mean a brief period of rental inflation of 4-5% a year, which would help offset the disinflationary impulses coming from elsewhere.
Another category that’s almost certainly going to be a source of faster inflation is health insurance. The Bureau of Labor Statistics estimates the “consumer price” of health insurance using a complex process based on changes in the profits of health insurers. The BLS measure focuses only on the direct cost to consumers even though most insurance costs are paid by employers.1
The BLS measure is prone to large swings up and down. On the eve of the pandemic, the CPI-health insurance measure had been rising by more than 20% a year. But in the past 12 months, insurance prices—as measured by the BLS—have dropped by 10%.
That swing subtracted about 0.35 percentage point from the yearly change in the broader CPI inflation rate in August 2021 compared to February 2020.
Fast food restaurants and domestic services are also worth keeping an eye on. The cost of “limited service meals and snacks” has soared by 7% a year since the pandemic began, while the price of domestic services is up 9% a year. Before the pandemic, prices in these categories were rising just 1-3% a year.
As I noted last month, the higher prices are partly a function of higher pay for low-paid line workers. But while we don’t have the wage numbers for domestic workers, the data so far imply that pay gains for restaurant workers have vastly oustripped the price increases imposed on consumers, especially since April.2
Average wage gains for nonsupervisory workers since April are running at about 20% annualized, while prices are rising around 8% annualized. Since the start of the pandemic, prices are up 6% at sitdown restaurants and up 10% at fast food restaurants, while average worker pay at both types of establishment has soared by more than 12%.
Prices at restaurants and for rental housing tend to be the best barometers of overall inflation pressure and the state of the economy, so it will be worth watching both categories closely in the months ahead even if other factors temporarily drag the broader index lower.
This is very different from the way the Bureau of Economic Analysis measures health insurance prices. That has already led and should continue to lead to some big gaps between the inflation rate implied by the CPI and by the Personal Consumption Expenditure price index, which is the Federal Reserve’s preferred measure.
The detailed pay data only run through July.


Mark,
You leave out one old-fashioned sector ....energy.
At this time a year ago, natural gas was around $1.80/mmsf, now its up to $5.00.
Propane was $1.05/gallon, now its $1.90.
crude oil was $40, now its over $70.
uranium, ignored for years, is also suddenly popping.
And the thing is, the entire economy is dependent upon energy for everything it does.
I guess the modern belief is that these things dont matter because we can replace them all with solar and wind and unicorn wing power ....but even if those things are possible as replacements, which has yet to be proved, then doing so will require an enormous amount of retooling, simply enormous.
In the meantime, since drillers have been reluctant, in the current political climate, to exercise new cap ex, we have current supplies that are way short of current consumption and our inventories are all being drawn down rather rapidly. I see a real crisis coming .....