
The Macro Impact of AI on GDP
Even if the underlying technology turned out to be mostly useless, the spending occurring right now is massive. And it may not be fully captured in the official GDP numbers.

Capital spending related to AI is growing so rapidly that it is now meaningful relative to the $30 trillion U.S. economy. Gross Domestic Product (GDP) was about 0.2%-0.3% larger in 2025Q2 than it would have been if businesses’ spending on data center construction, computers and peripheral equipment, and communications equipment had grown in line with the 2011Q1-2022Q31 trend.
Moreover, this impact is likely understated, because existing methodologies are (probably) not fully capturing the investment being done by the five companies responsible for the bulk of the data center buildout: Amazon, Google, Meta, Microsoft, and Oracle. Those five companies also happen to be the ones with the five largest capex budgets in the entire S&P 500 in 2025Q2.
I estimate that U.S. GDP would be about 0.4% higher than currently reported—or about 0.6% higher than if there had been no AI boom—if the capital expenditures of the big 5 were fully incorporated into the official data. Or put yet another way, the growth in direct AI-related capex by the big 5 since mid-2023 would correspond to about 10% of the total increase in the dollar value of U.S. GDP over the past two years. Including additional capital spending on power plants and electricity generation would lead to an even larger number.
That matters, especially if this spending turns out to be unprofitable and the big 5 retrench in the face of losses. The post-2000 tech bust was a catastrophe for U.S. business investment and employment, even if the preceding bubble bequeathed the country with a fiber optic network still in use today.
The rest of this note features a more detailed examination of the numbers behind these estimates, as well as some skepticism about more outlandish claims concerning the economic impact of AI.
How the Government Measures Investment
The Bureau of Economic Analysis (BEA), which calculates the GDP numbers, divides business investment into three basic categories: structures2, equipment, and “intellectual property”. They explain their methodology and source data in chapter six of the handbook on the National Income and Product Accounts (NIPAs).
The general principle is that investment is equivalent to spending by businesses on assets, whether physical or intangible, that “are used repeatedly or continuously in the production process—that is, in the production of other goods (including other fixed assets) or of services—for more than 1 year”. The BEA measure of investment includes spending on machinery, software, and buildings, as well as spending on research and development that companies normally count as operating expenses on their income statements. It does not include spending on intermediate inputs that are used once and then disappear, such as electricity, advertising services, or materials and components for manufacturing.
AI-related investment now involves everything from laying more fiber optic cables to building new power plants, but for the sake of simplicity I am focusing on a few components within the NIPAs that seem to map most cleanly to the capital expenditures reported in companies’ cash flow statements: data centers (part of structures), computers and peripheral equipment, and communications equipment. A broader measure could also include “special industry machinery not elsewhere classified” (includes chipmaking equipment) and “electrical transmission, distribution, and industrial apparatus” because those also seem to have responded to the surge in AI-related spending, but the macro results do not look much different. Research and development spending is also being affected by the boom in AI but not nearly as much.
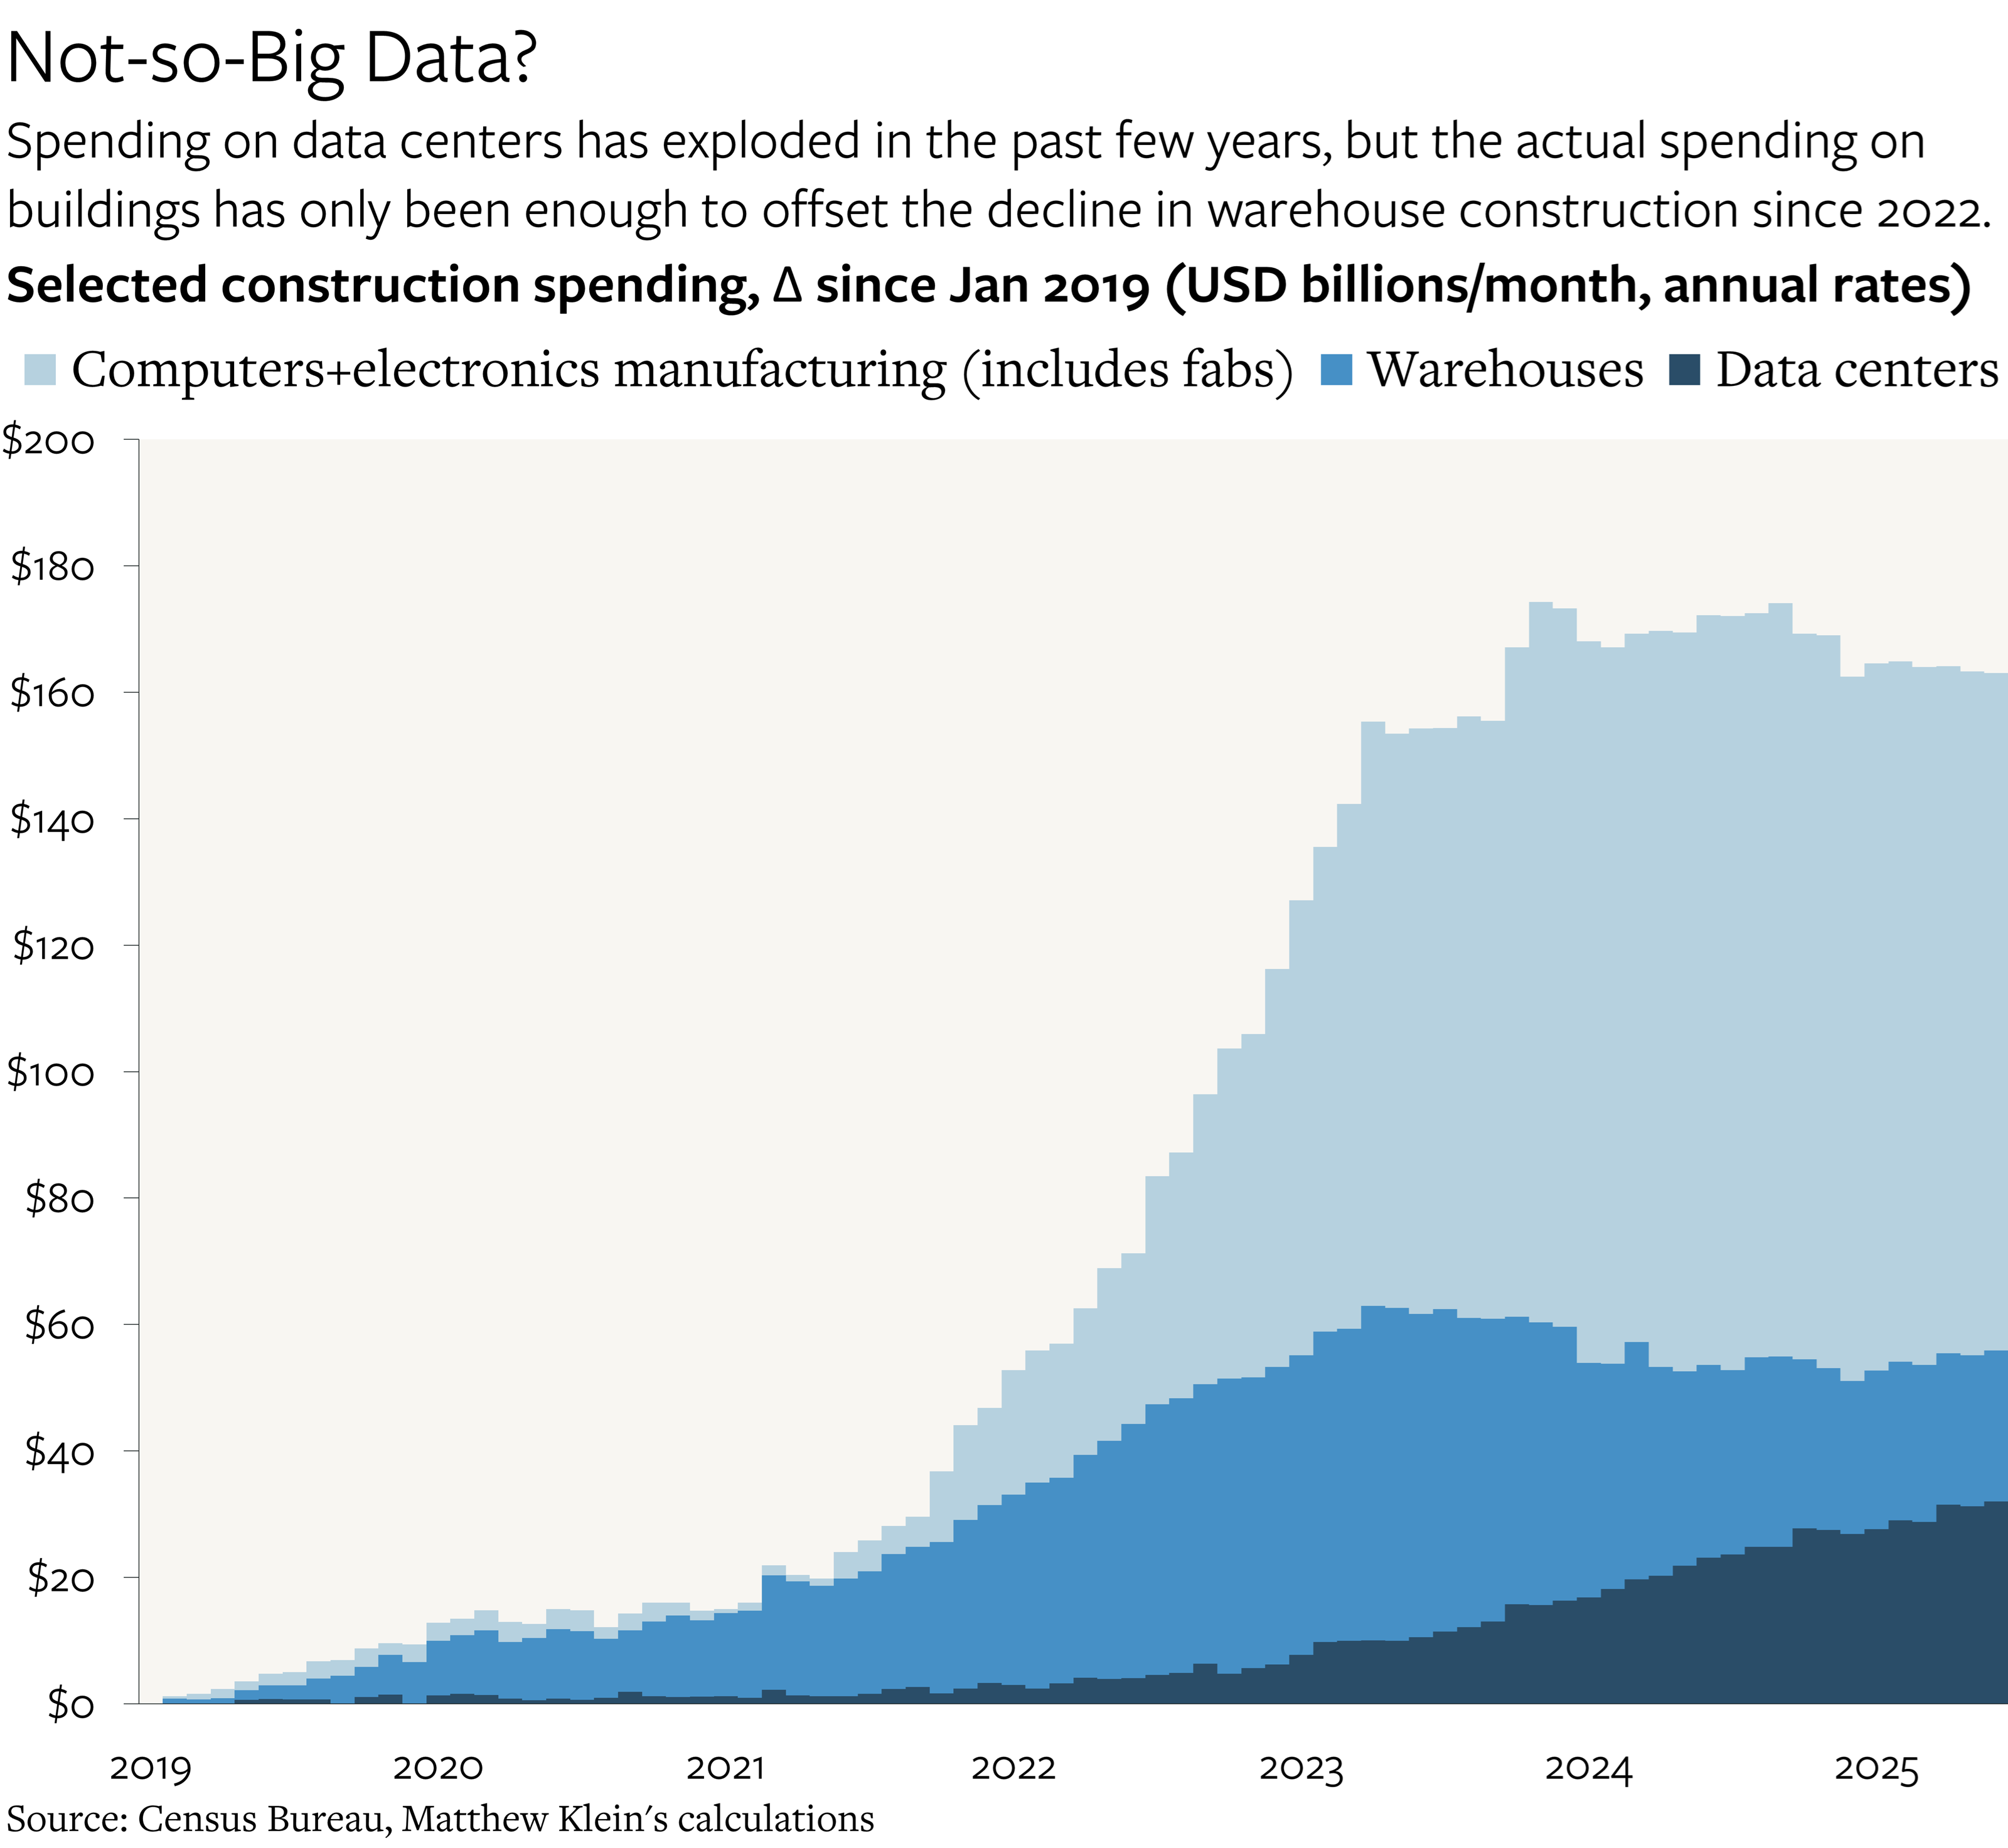
Most of the BEA’s estimates of nonresidential structures investment ultimately come from the Census Bureau. The Census has monthly estimates of construction spending on data centers going back to 2014, although the numbers are only available in the depths of downloadable spreadsheets. Data center construction is bundled inside the broader category of “office”, presumably because office buildings and data centers are both climate-controlled buildings with lots of computers inside. The growth in this category has been extraordinary over the past few years, but it started from a very low base. The numbers reported by the Census make clear that it has only been sufficient to offset the slowdown in warehouse construction, which had surged during the pandemic-induced e-commerce boom only to normalize in the years since. Spending on new chip fabs dwarfs both.
The Census numbers only track how much is spent putting up the buildings (and integrated equipment such as HVAC systems). But most of the capex is going to the servers and related equipment inside the buildings.