

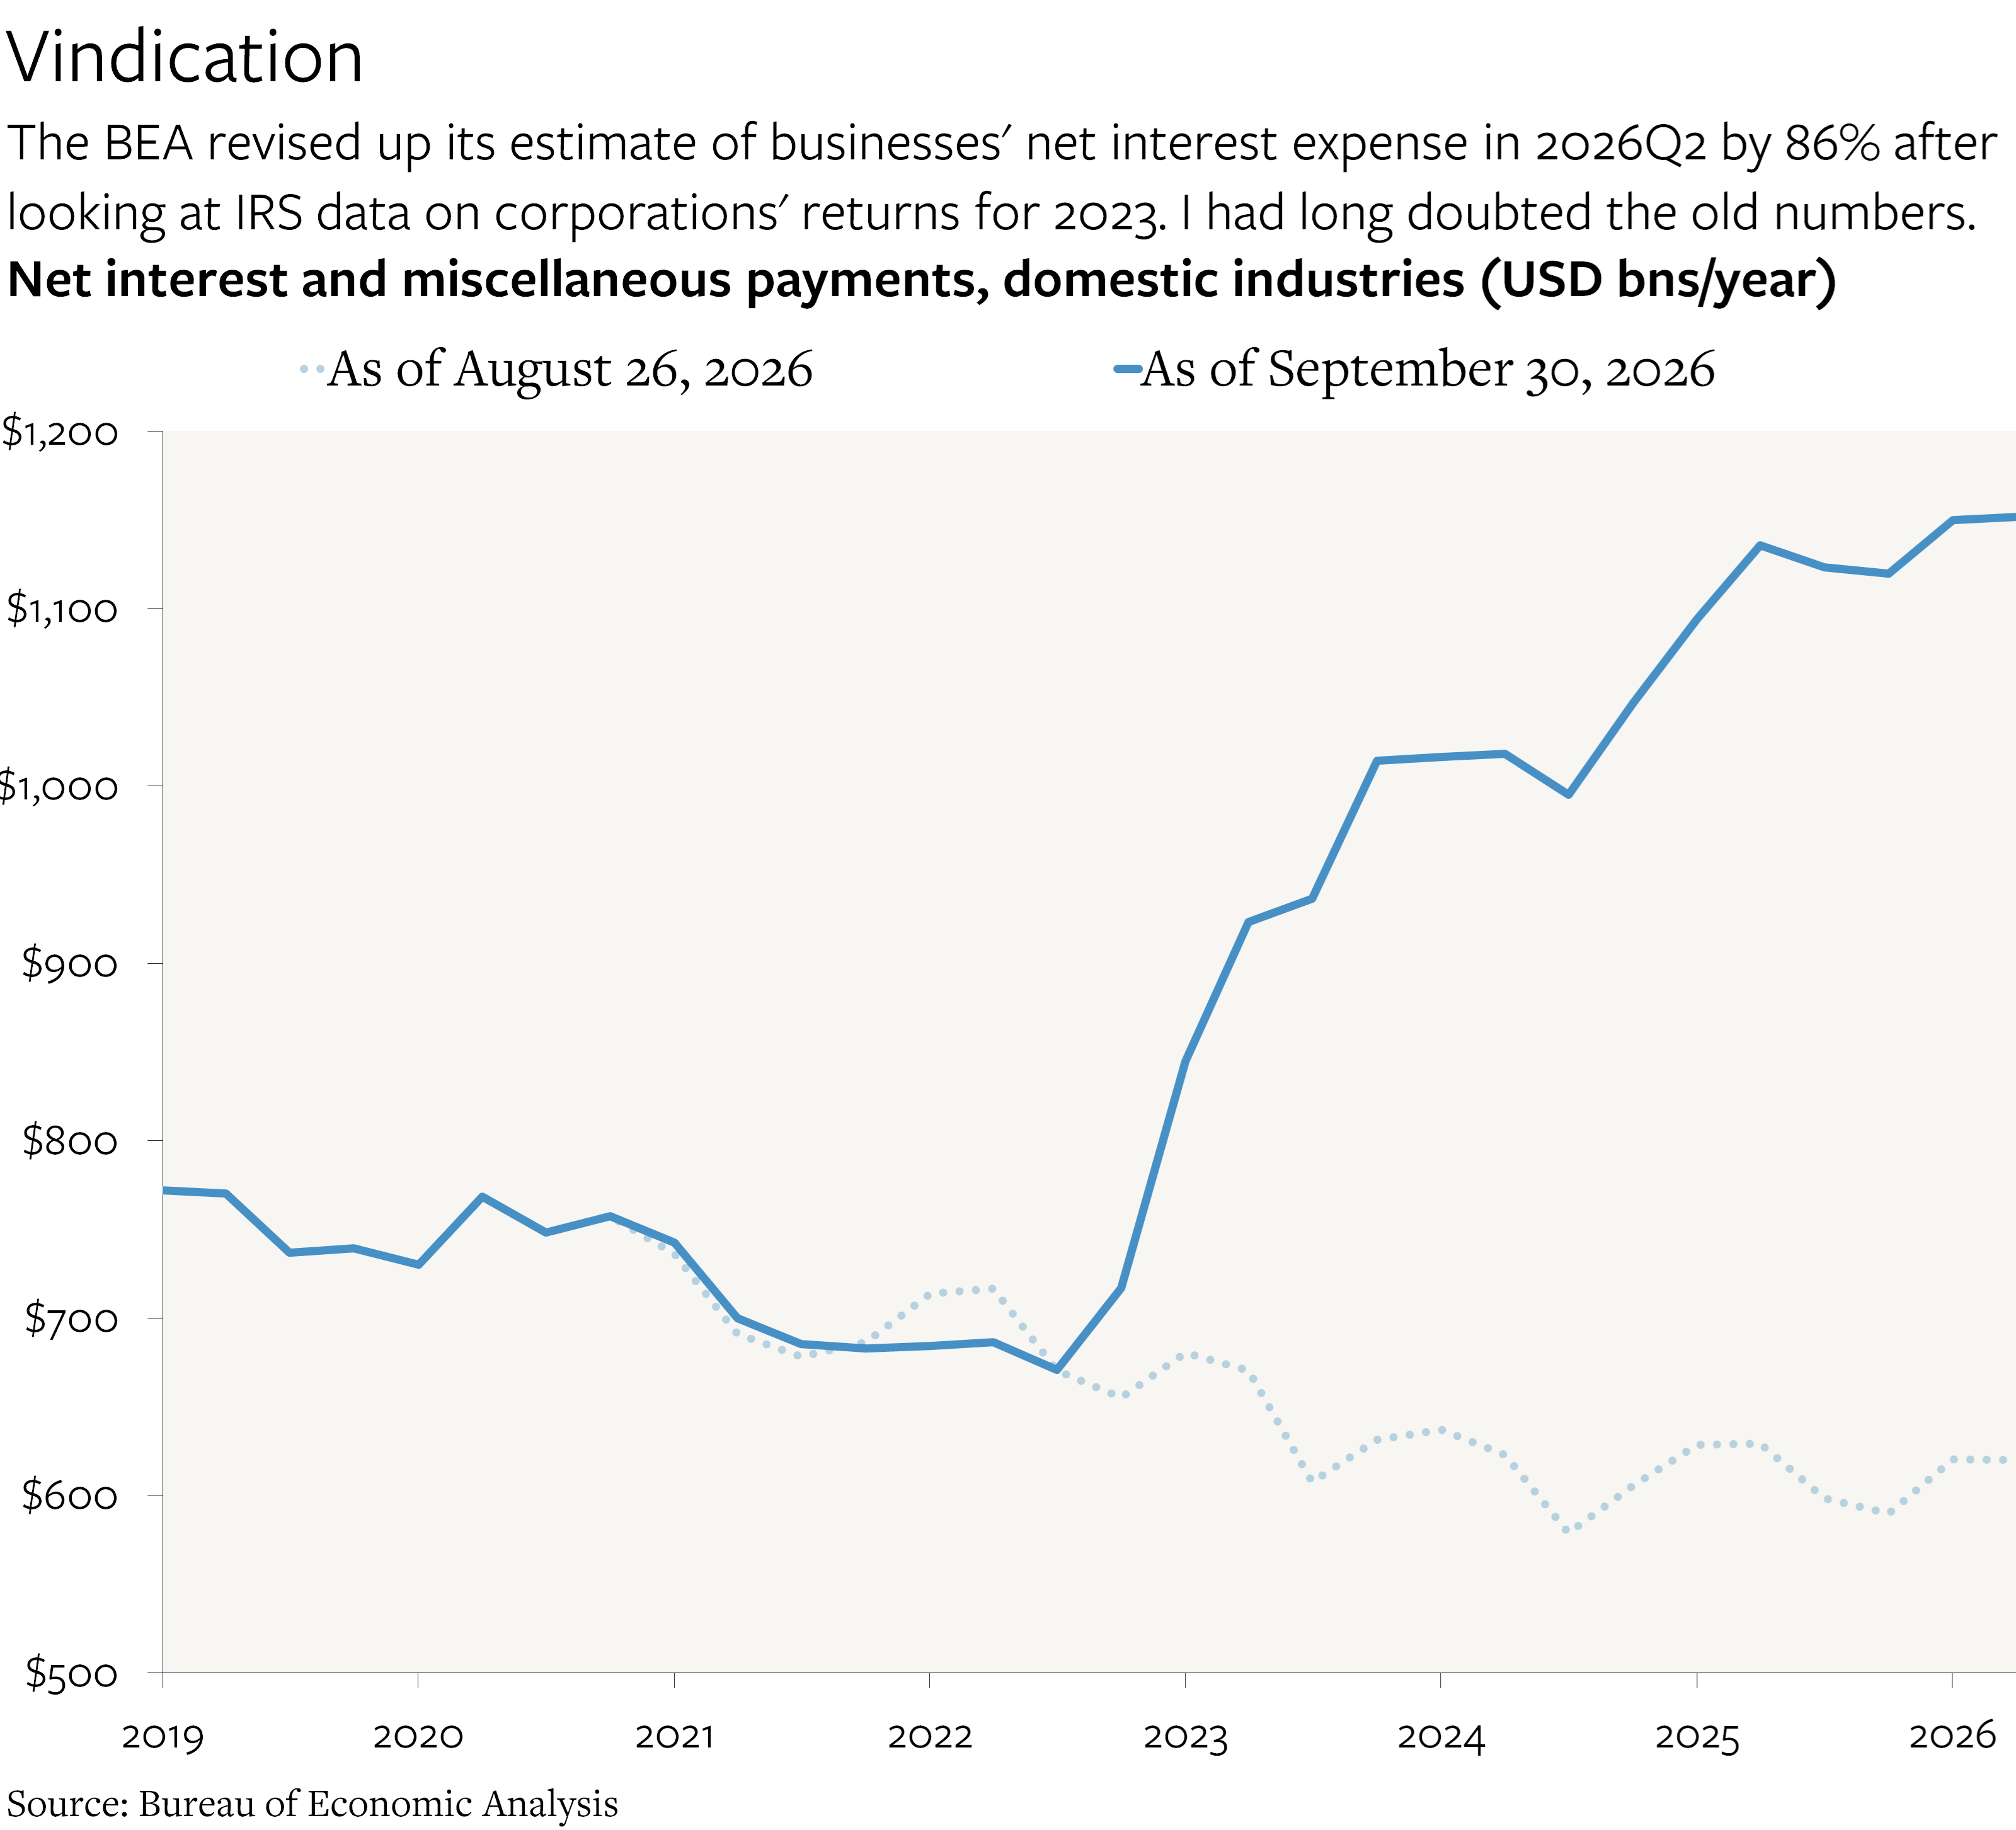
It has been three-and-a-half years since I first wrote that the Bureau of Economic Analysis (BEA) was publishing implausible estimates of American businesses’ net interest expense. I repeatedly questioned these estimates and argued that income-based measures were understating both the level and growth rate of U.S. economic activity. As recently as August 26, the official estimate of net interest payments by U.S. corporations in 2026Q2 was negative. I was incredulous.
It is therefore my great pleasure to report that the BEA has finally revised its estimates for the past five years—and that my earlier skepticism has been completely vindicated. Using the latest available corporate tax data, which, somehow, are only from 2023, the BEA revised up “net interest and miscellaneous payments, domestic industries” by 86% ($532 billion annualized), which in turn boosted their overall estimate of the income generated in the U.S. by about 2%.
What follows is a detailed review of the BEA’s methodology, why I was skeptical of the published data at the time, what the current estimates imply about where the missing interest income was, and what it means for our understanding of how the economy is doing now.
The Mystery of the Missing Interest Revisited
Net interest payments by nonfinancial corporations were ostensibly collapsing at the fastest yearly pace on record between 2022Q3 and 2023Q3. When the data were first being published, the picture looked similar for the business sector as a whole, but the 2024 revisions partly fixed the error for noncorporate businesses, which explains the divergence between the dotted light blue and pink lines in the chart below.
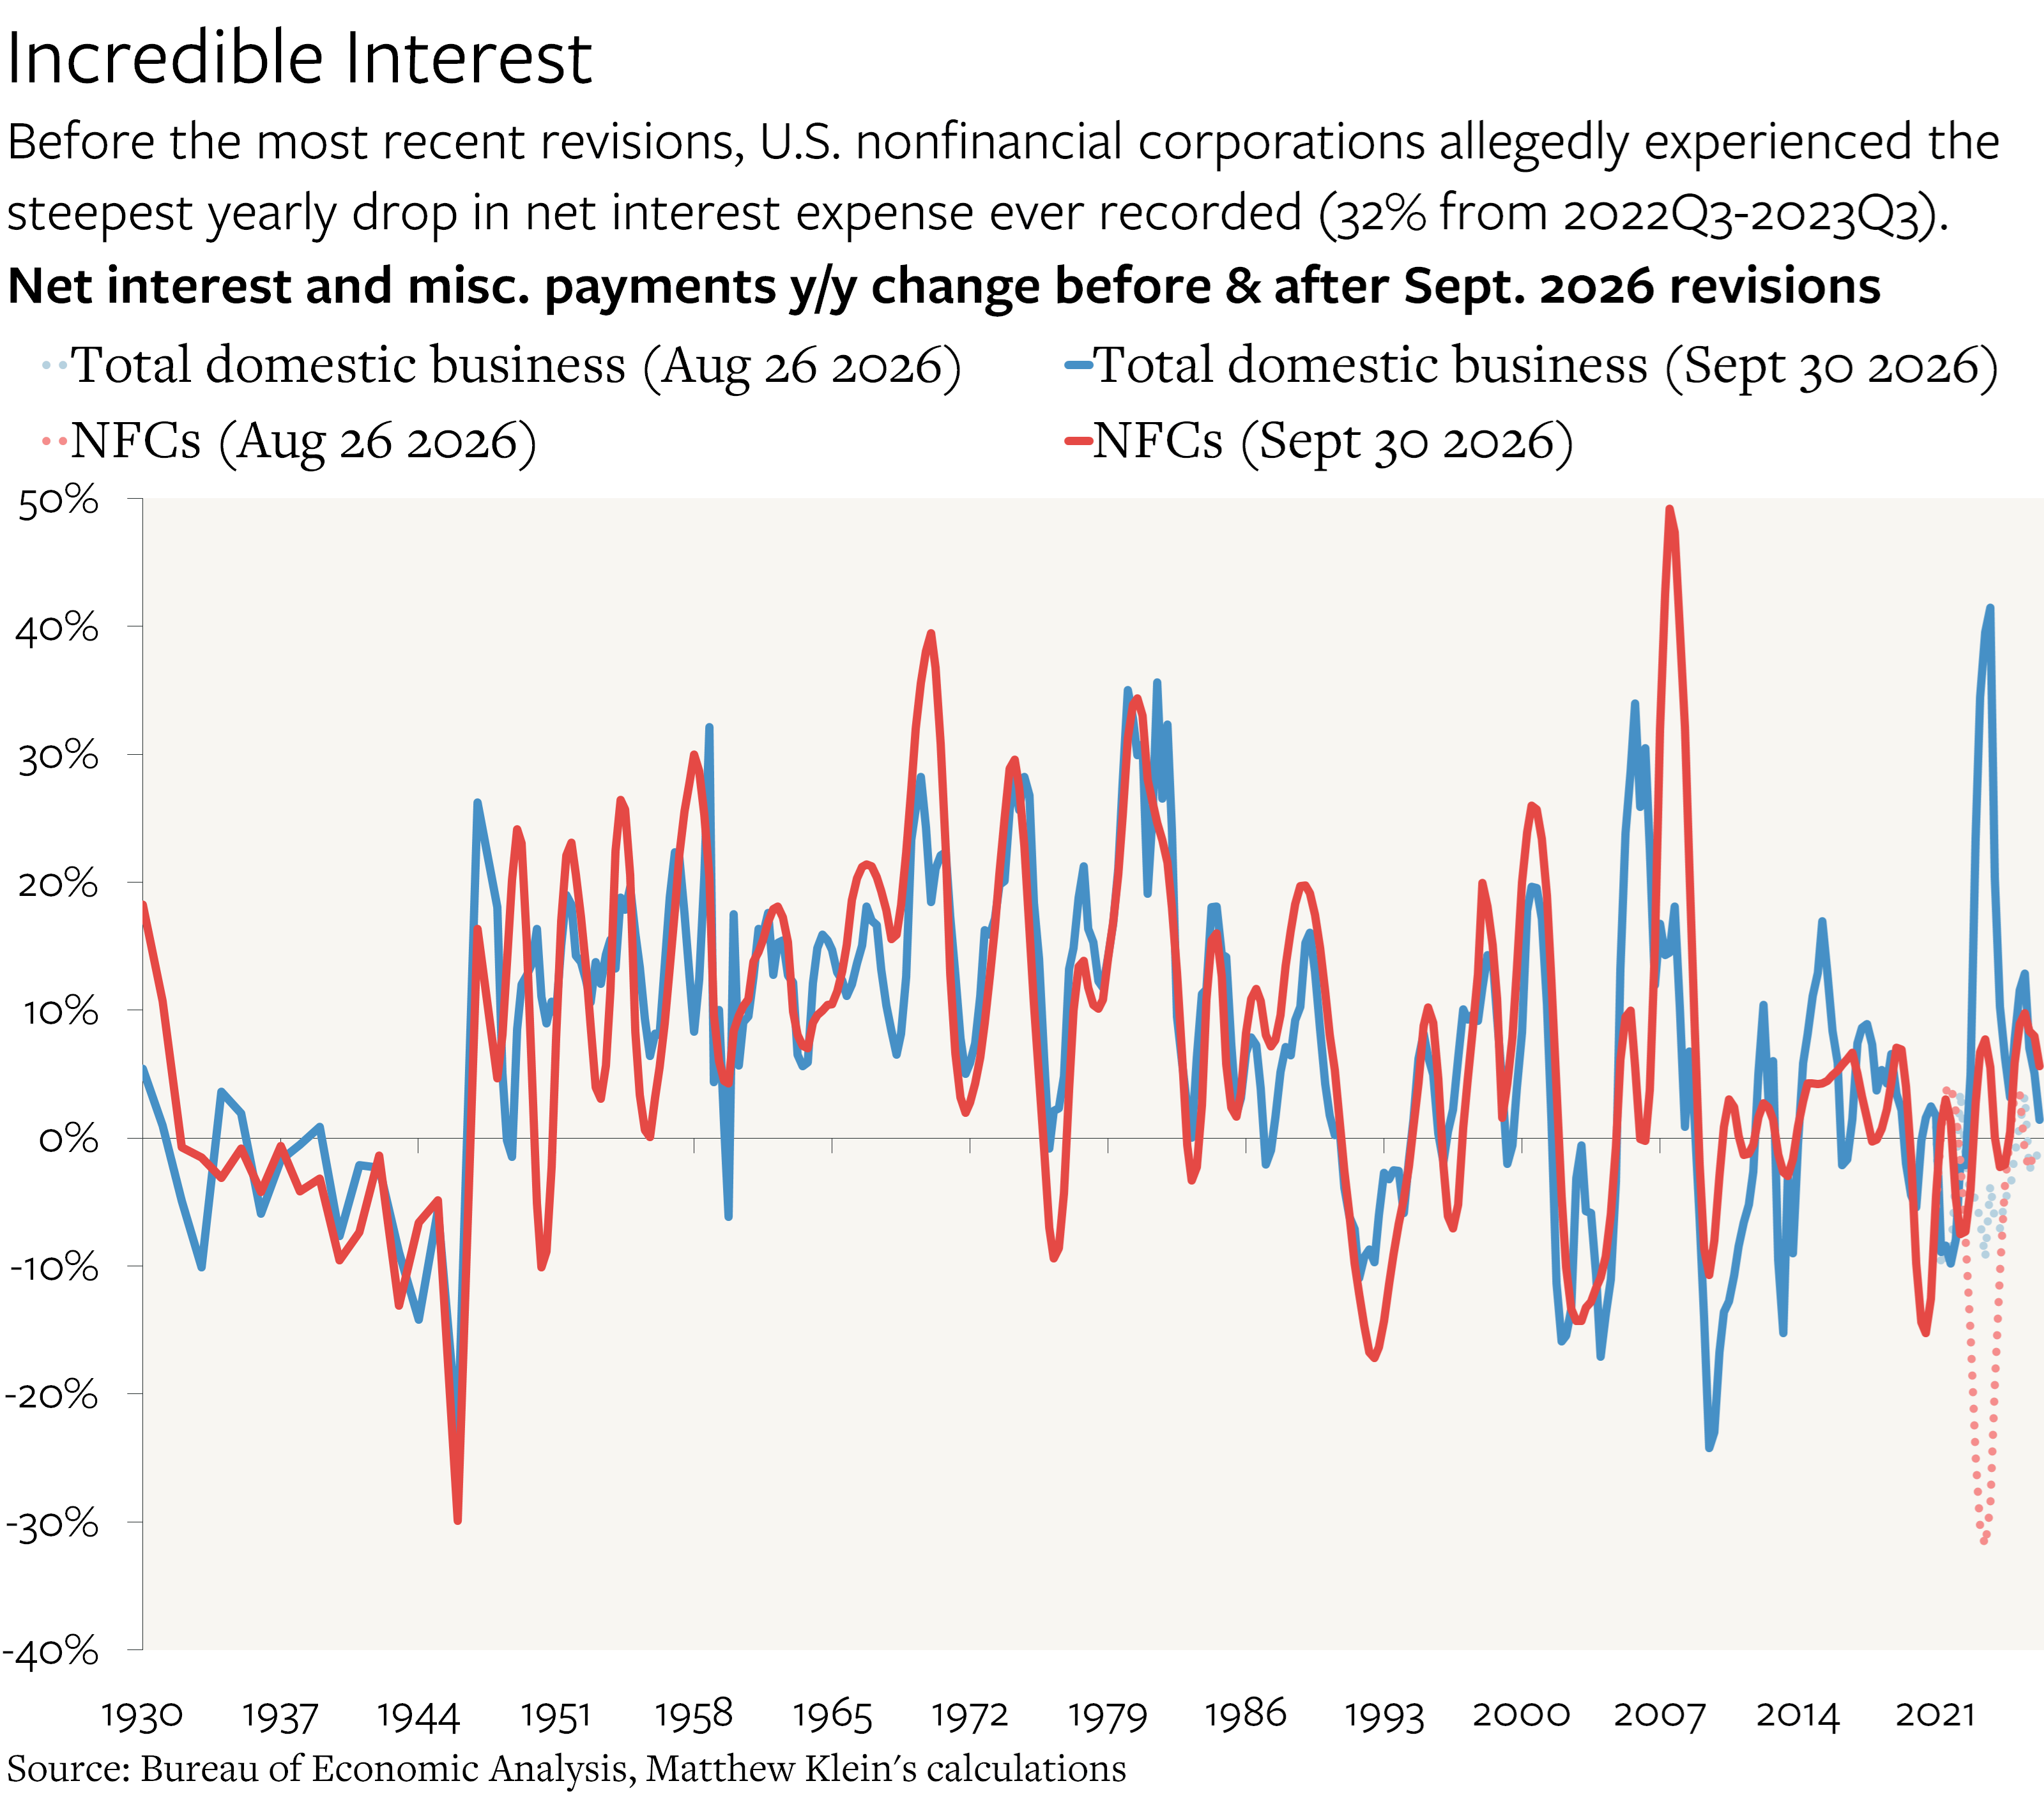
That seemed obviously wrong, no matter how much companies had tried to term out their debts in 2020-2021.
Borrowing costs had soared, companies in the aggregate still owed much more in debt than they held in interest-bearing assets, companies had been adding debt more rapidly than they had been adding to their holdings of cash and equivalents, much of their debt consisted of floating-rate loans rather than fixed-rate bonds. Moreover, we now know that much of the additional debt taken on since 2022Q1 has been relatively high-yielding floating-rate loans: private credit loans, loans from hedge funds, and loans from nonbank finance companies held by asset-backed securities issuers (CLOs).
As I pointed out at the time, the financial accounts data from the Federal Reserve on balance sheets and debt issuance/cash accumulation, plus basic market data on yields for bonds, loans, and money funds, suggested that the BEA estimates were implausible.
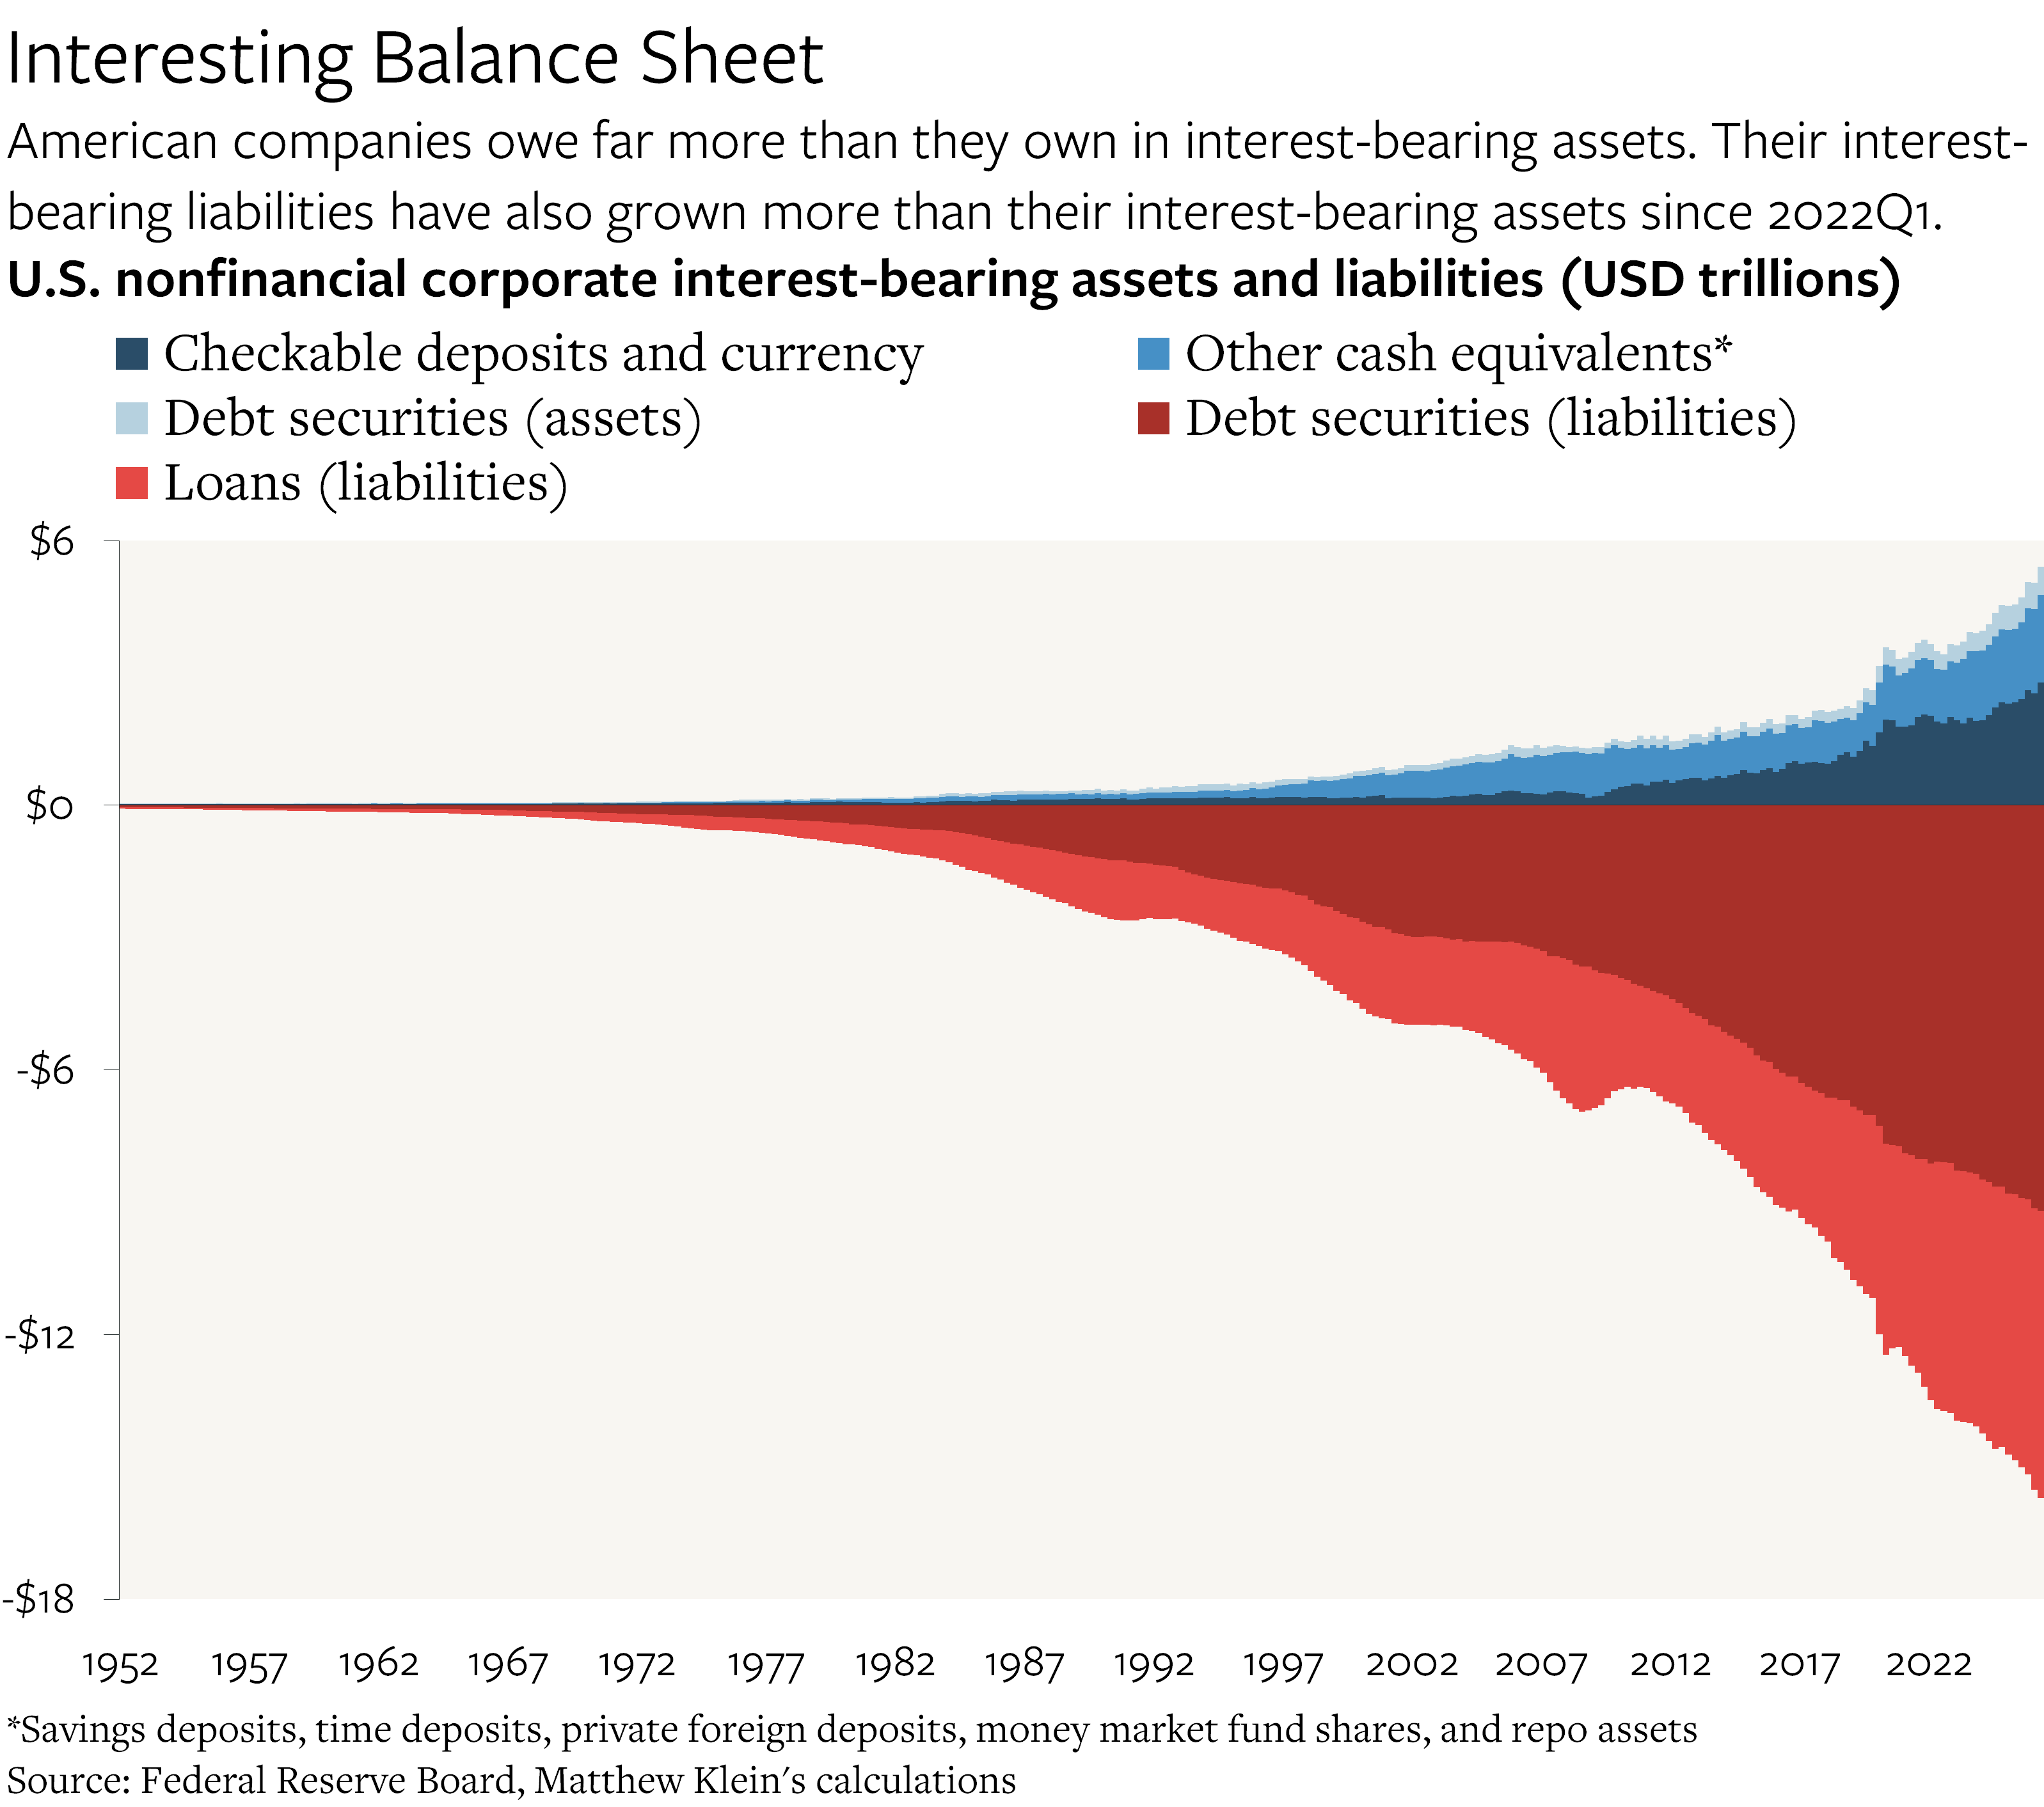
That said, it is worth noting that the gap between nonfinancial corporations’ bond+loan assets and their bond+loan liabilities has been essentially flat since 2022Q3 at ~$10.2 trillion. That is normal following periods of rapid borrowing (see also the early 1990s and early 2000s) but it is does not explain the apparent decline in net interest payments during a period of rapidly rising rates.