
Inflation Is Moving the Wrong Way
Even if we try to "look through" the impact of tariffs, which could be unwise, the inflationary trend remains persistently faster than before the pandemic, and possibly faster than in 2024.

The Consumer Price Index (CPI) and Producer Price Index (PPI) for July 2025 may be among the last unimpeachable set of inflation numbers the U.S. government produces.
After deciding that they did not like the latest estimate of payroll employment, the people in the White House fired the commisioner of the Bureau of Labor Statistics (BLS) and nominated a replacement so unsuitable for the position that many right-wing economists as well as the Wall Street Journal’s editorial board have criticized him.
While it is unclear what exactly a partisan commissioner would be able to do to directly manipulate the numbers, there is plenty of scope for a malign actor to corrupt the integrity of the process, worsen the reliability of the estimates, and make it harder for data consumers to trust the official figures. That also has implications for the many contracts linked to official inflation measures, including taxes, the principal and coupons on Treasury Inflation-Protected Securities (TIPS), inflation swaps, government welfare benefits, and many minimum wages.
Regardless of whether it will actually do so, this administration has made it clear why it would want to interfere with the inflation numbers: inflation is unpopular, the government can spend less and tax more if official inflation measures are understated, and benign inflation prints would make it easier for the Federal Reserve to lower interest rates.
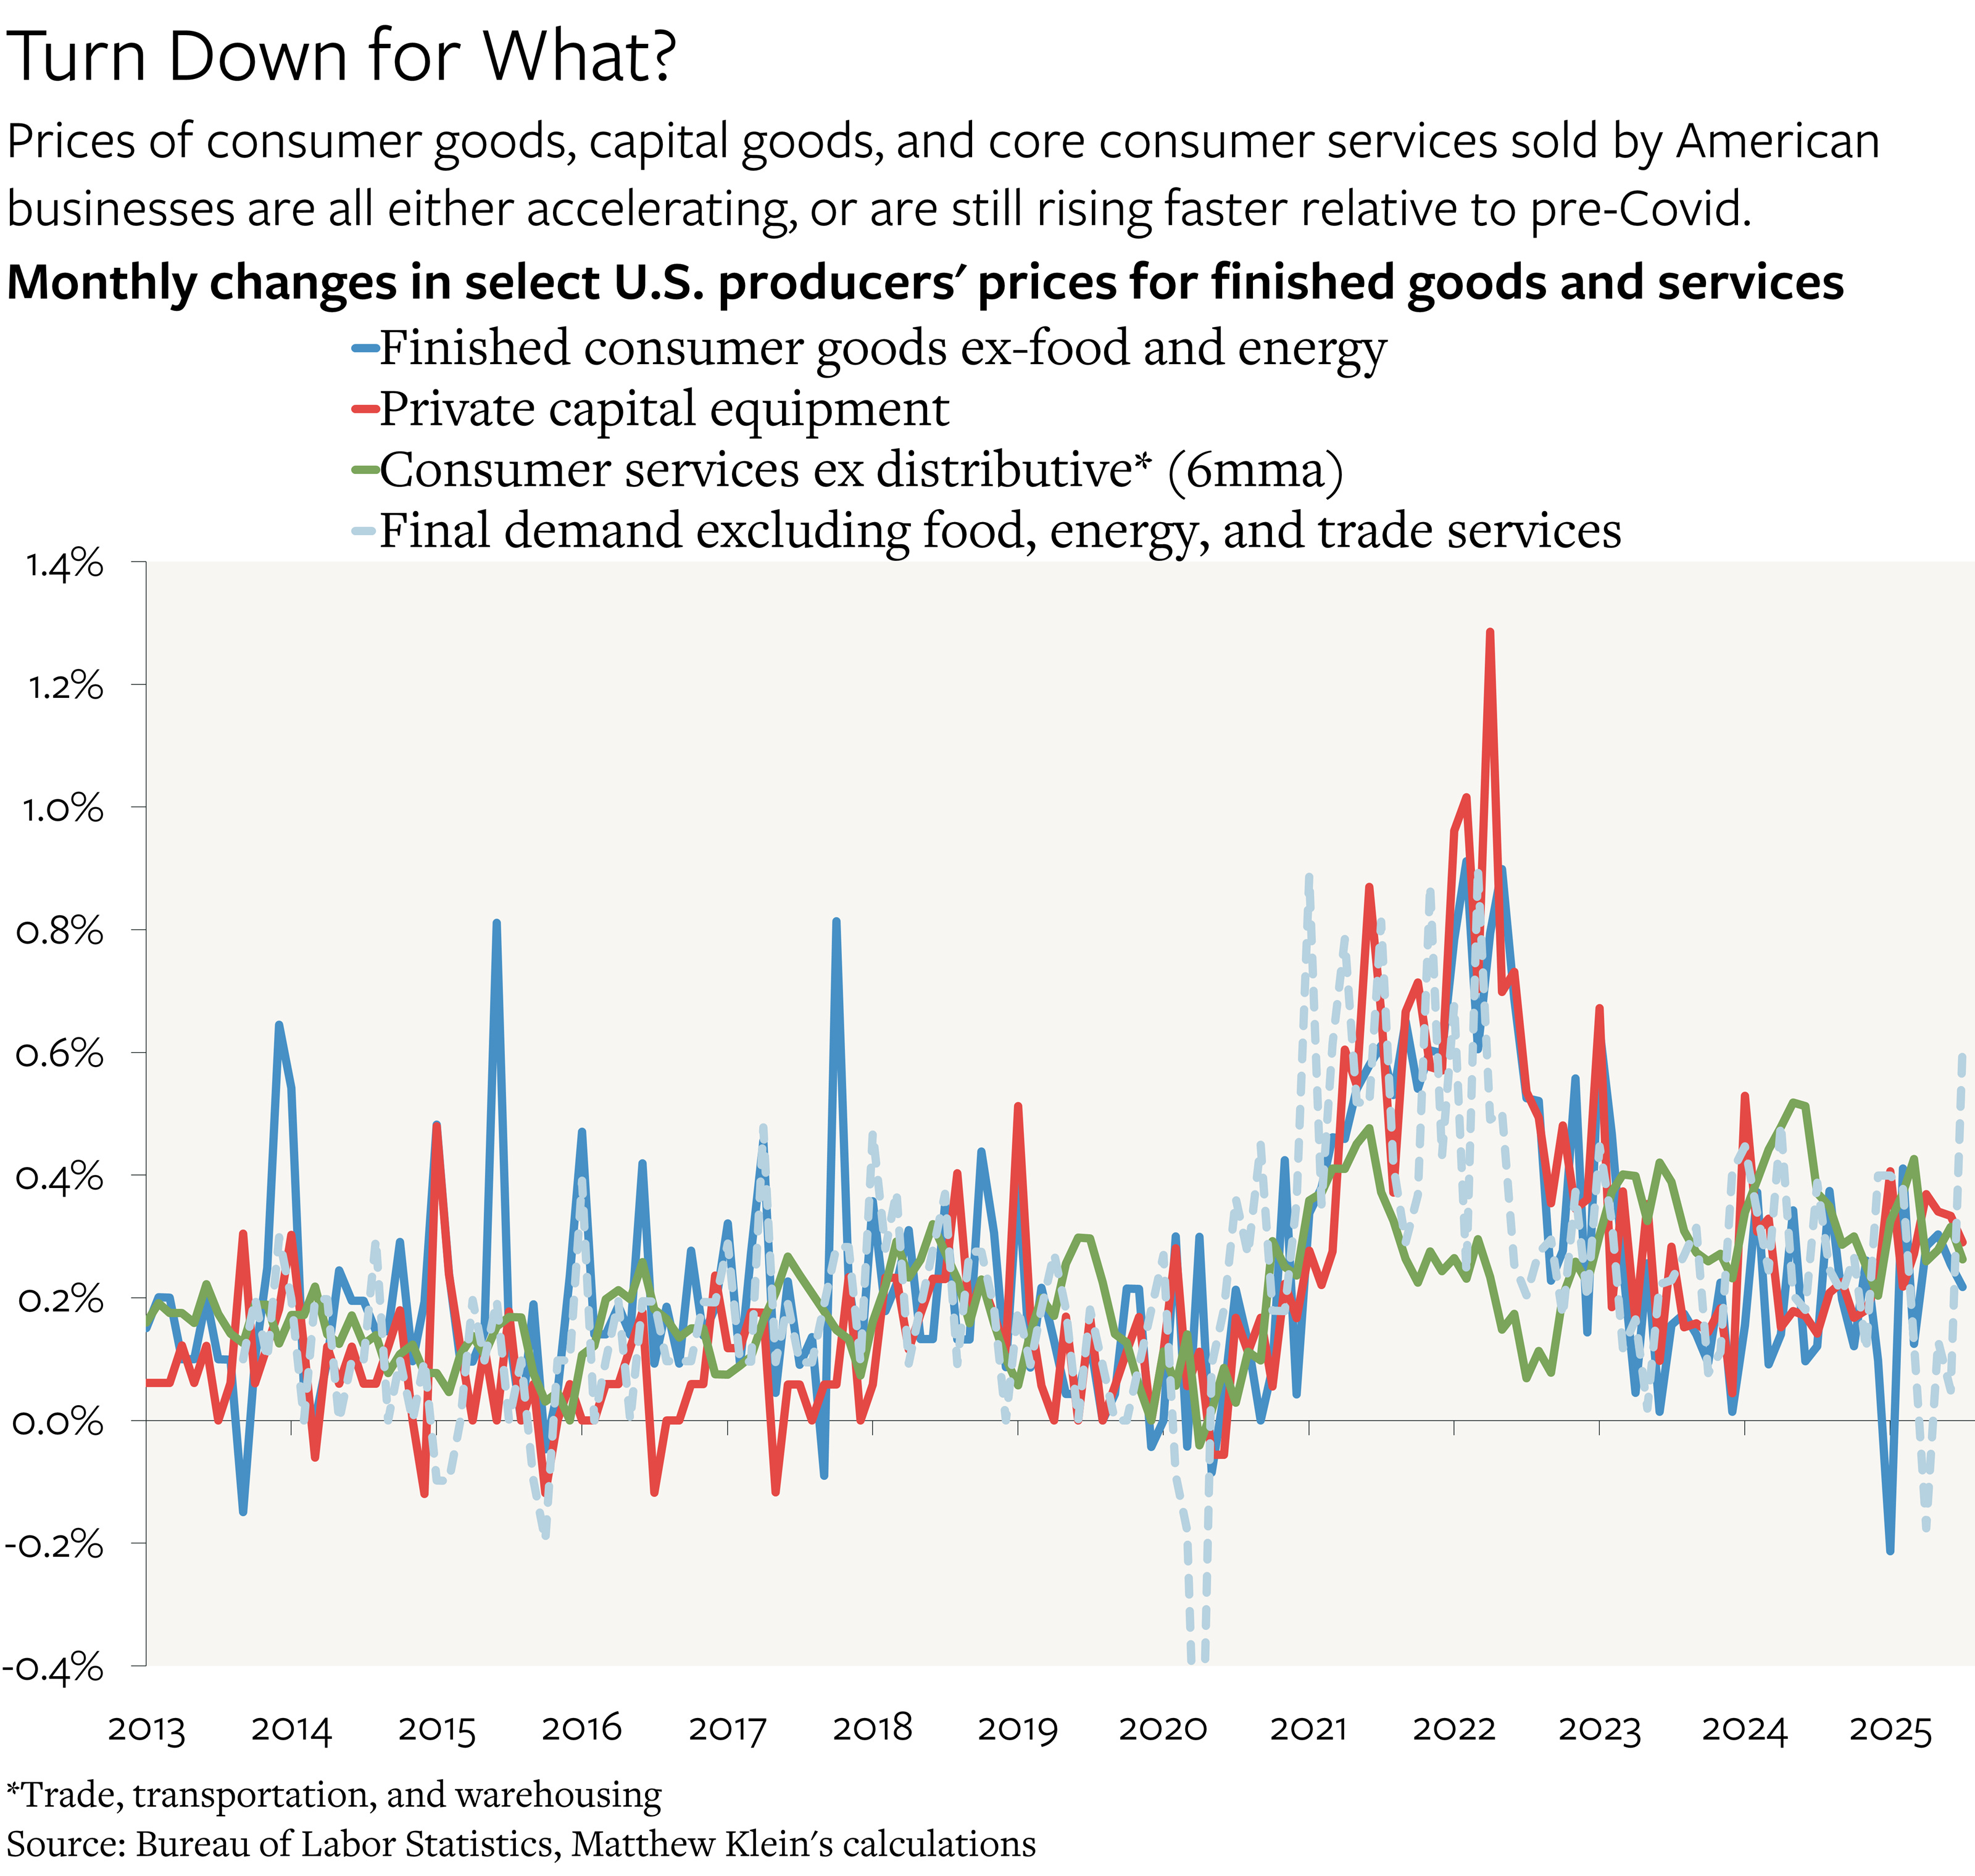
Unfortunately for them, the inflation data as of July are far from benign. Excluding food, energy, and distribution, the prices of goods and services sold to consumers, or as capital goods to businesses, jumped by the most on a seasonally-adjusted basis since March 2022. This reflects persistently faster inflation in core consumer services as well as an unwelcome turn in manufactured goods prices.
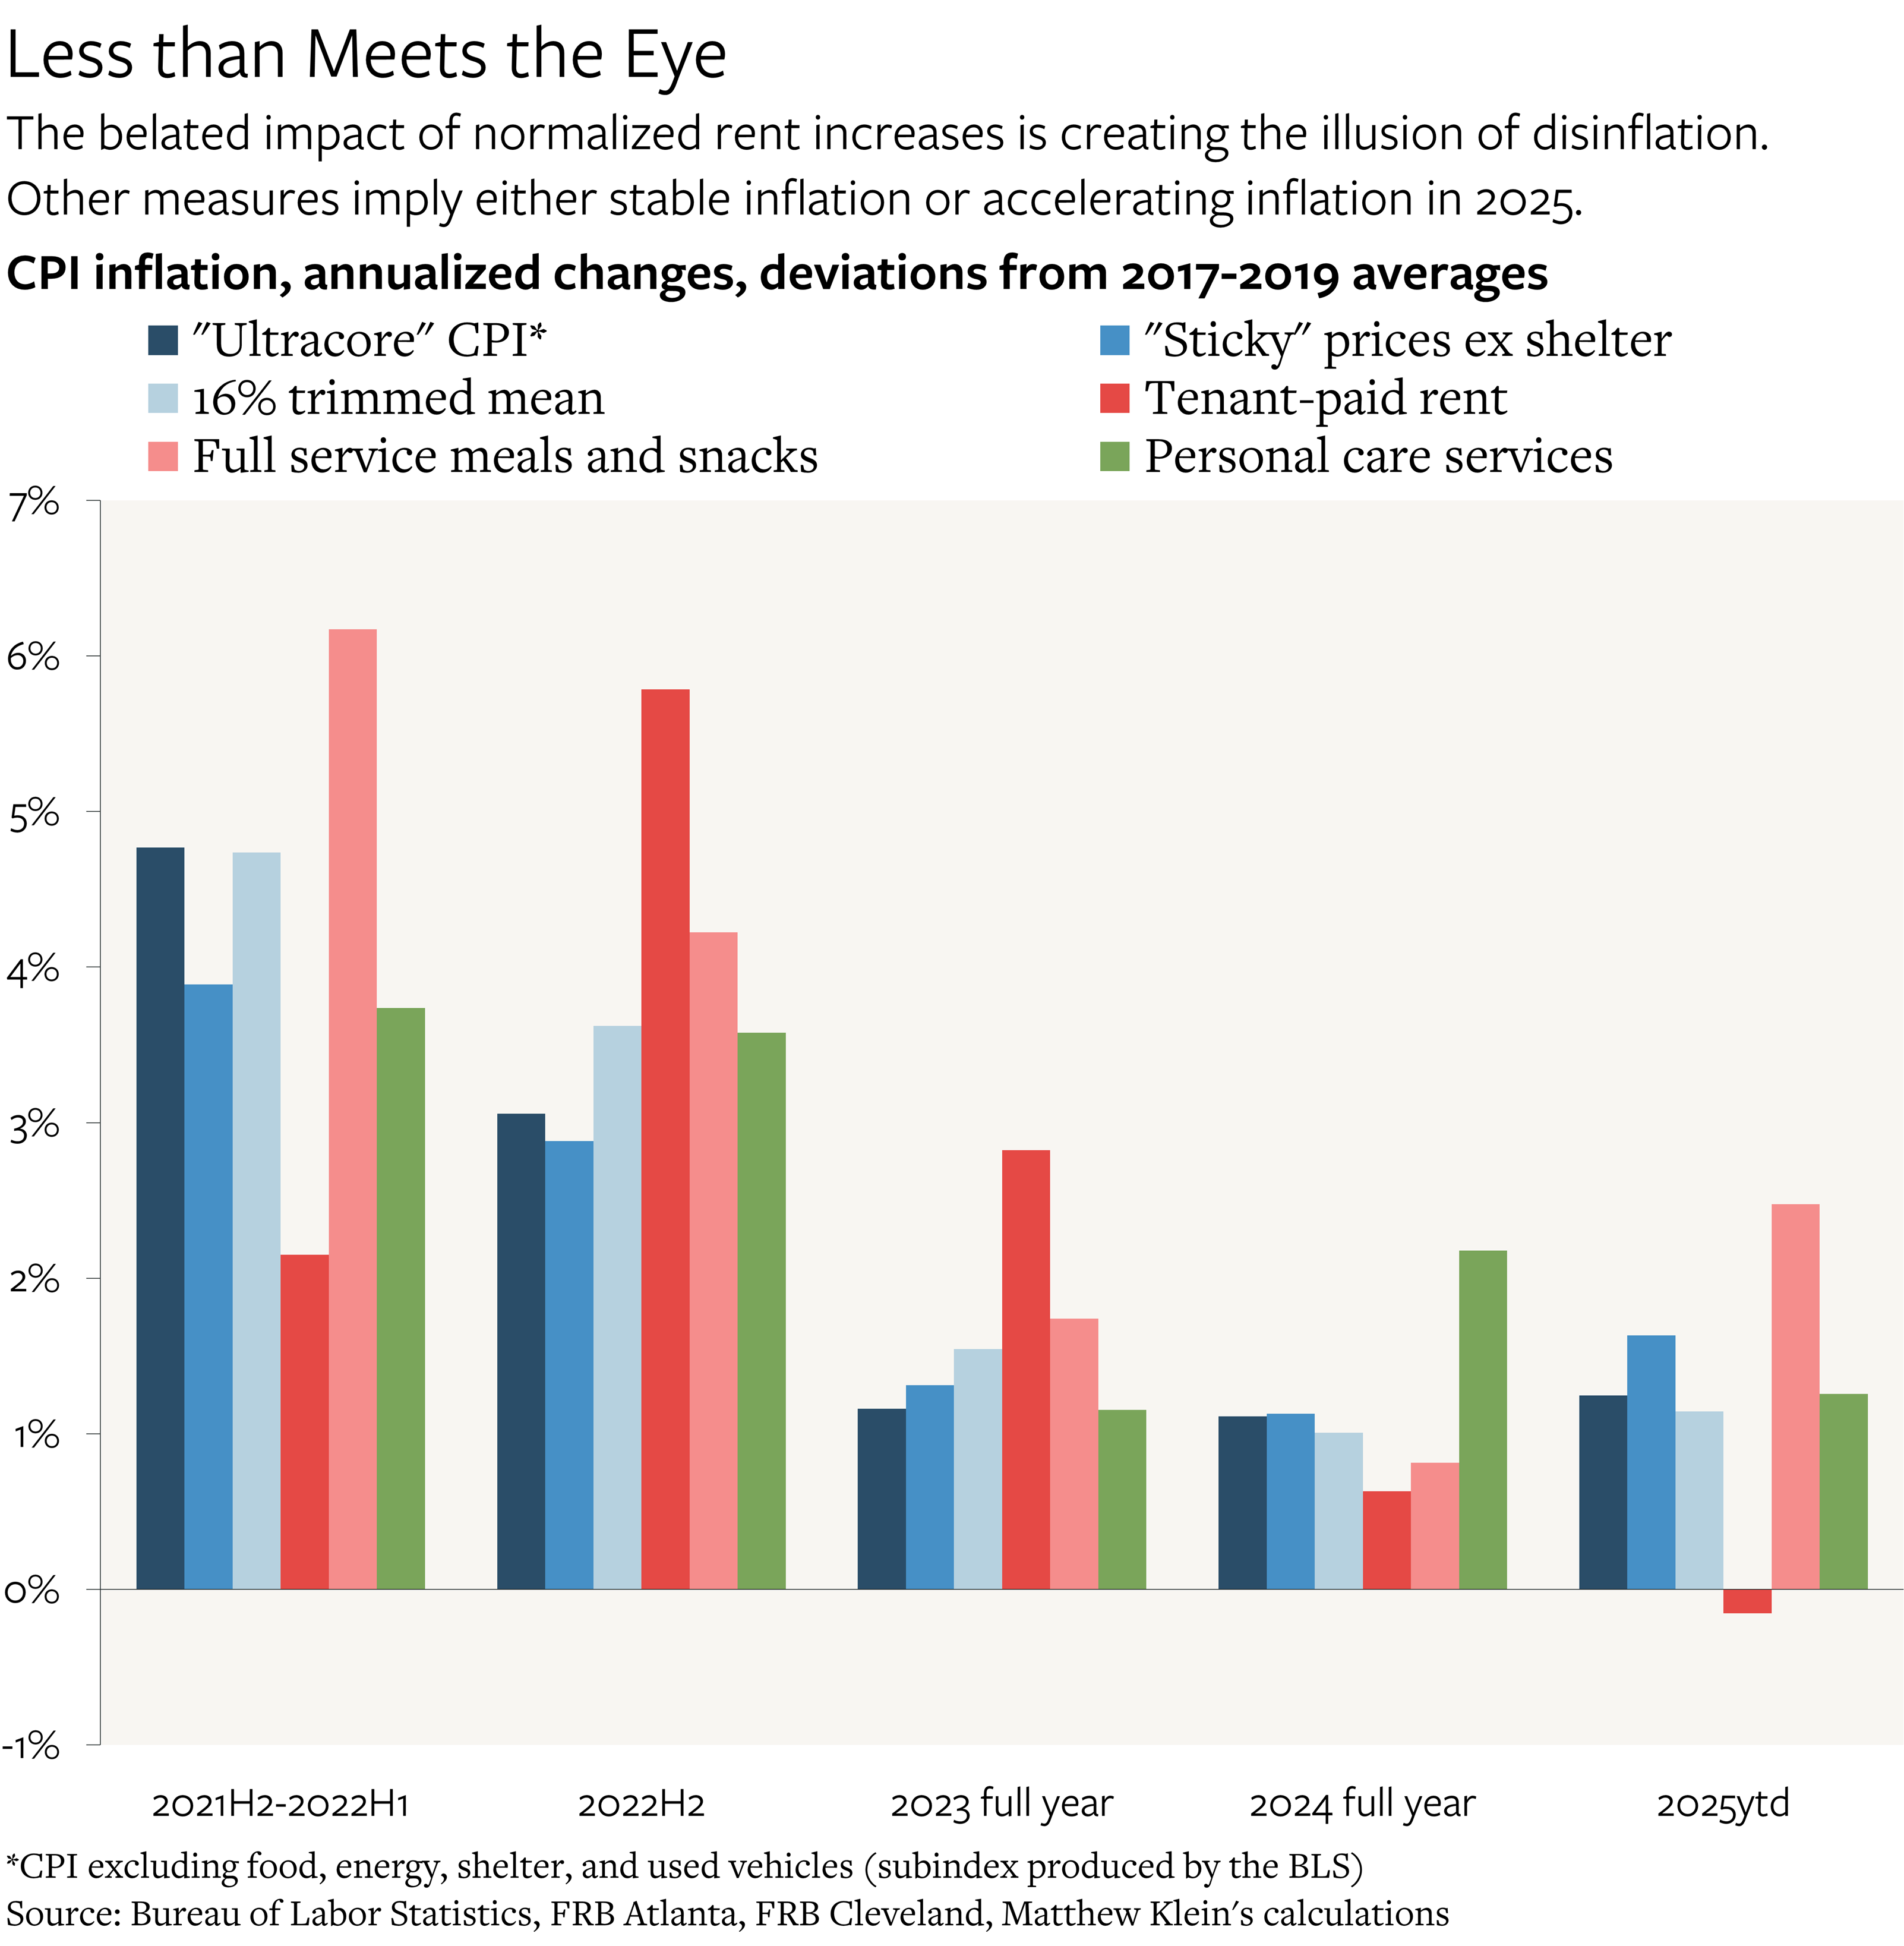
Even in categories that should be relatively insulated from tariffs, such as sit-down restaurant meals, dental visits, and personal care services,1 price increases have either accelerated sharply, or have failed to decelerate since 2023. Thus, despite the month-on-month declines or pauses (per the CPI) in price increases for many tariff-exposed goods such as appliances, “other household equipment and furnishings”2, housekeeping supplies, apparel, new vehicles, personal care products, and books, many measures of underlying CPI inflation spiked in July, rising at the fastest rates since early 2024, or sometimes early 2023.
More broadly, the trend in inflation across a range of components and sub-indexes seems to be accelerating from a pace that was already stubbornly (but only slightly) faster than before the pandemic. The ongoing—and massively lagged—slowdown in official measures of housing costs, which I have highlighted before, plus recent declines in prices for hotels3 and air travel, which may be attributable to declines in tourism from abroad, are masking what else is happening across both services and goods.
The July Reading in Context
The CPI as a whole rose by just 0.2% between June and July on a seasonally-adjusted basis, equivalent to a yearly rate of just 2.4%. The annualized increase in the CPI over the past six months is just 1.9%. Given the tendency for CPI inflation to run slightly faster than the Personal Consumption Expenditures (PCE) Price Index—Fed officials’ preferred measure—one might conclude that everything is fine. That would be a mistake.
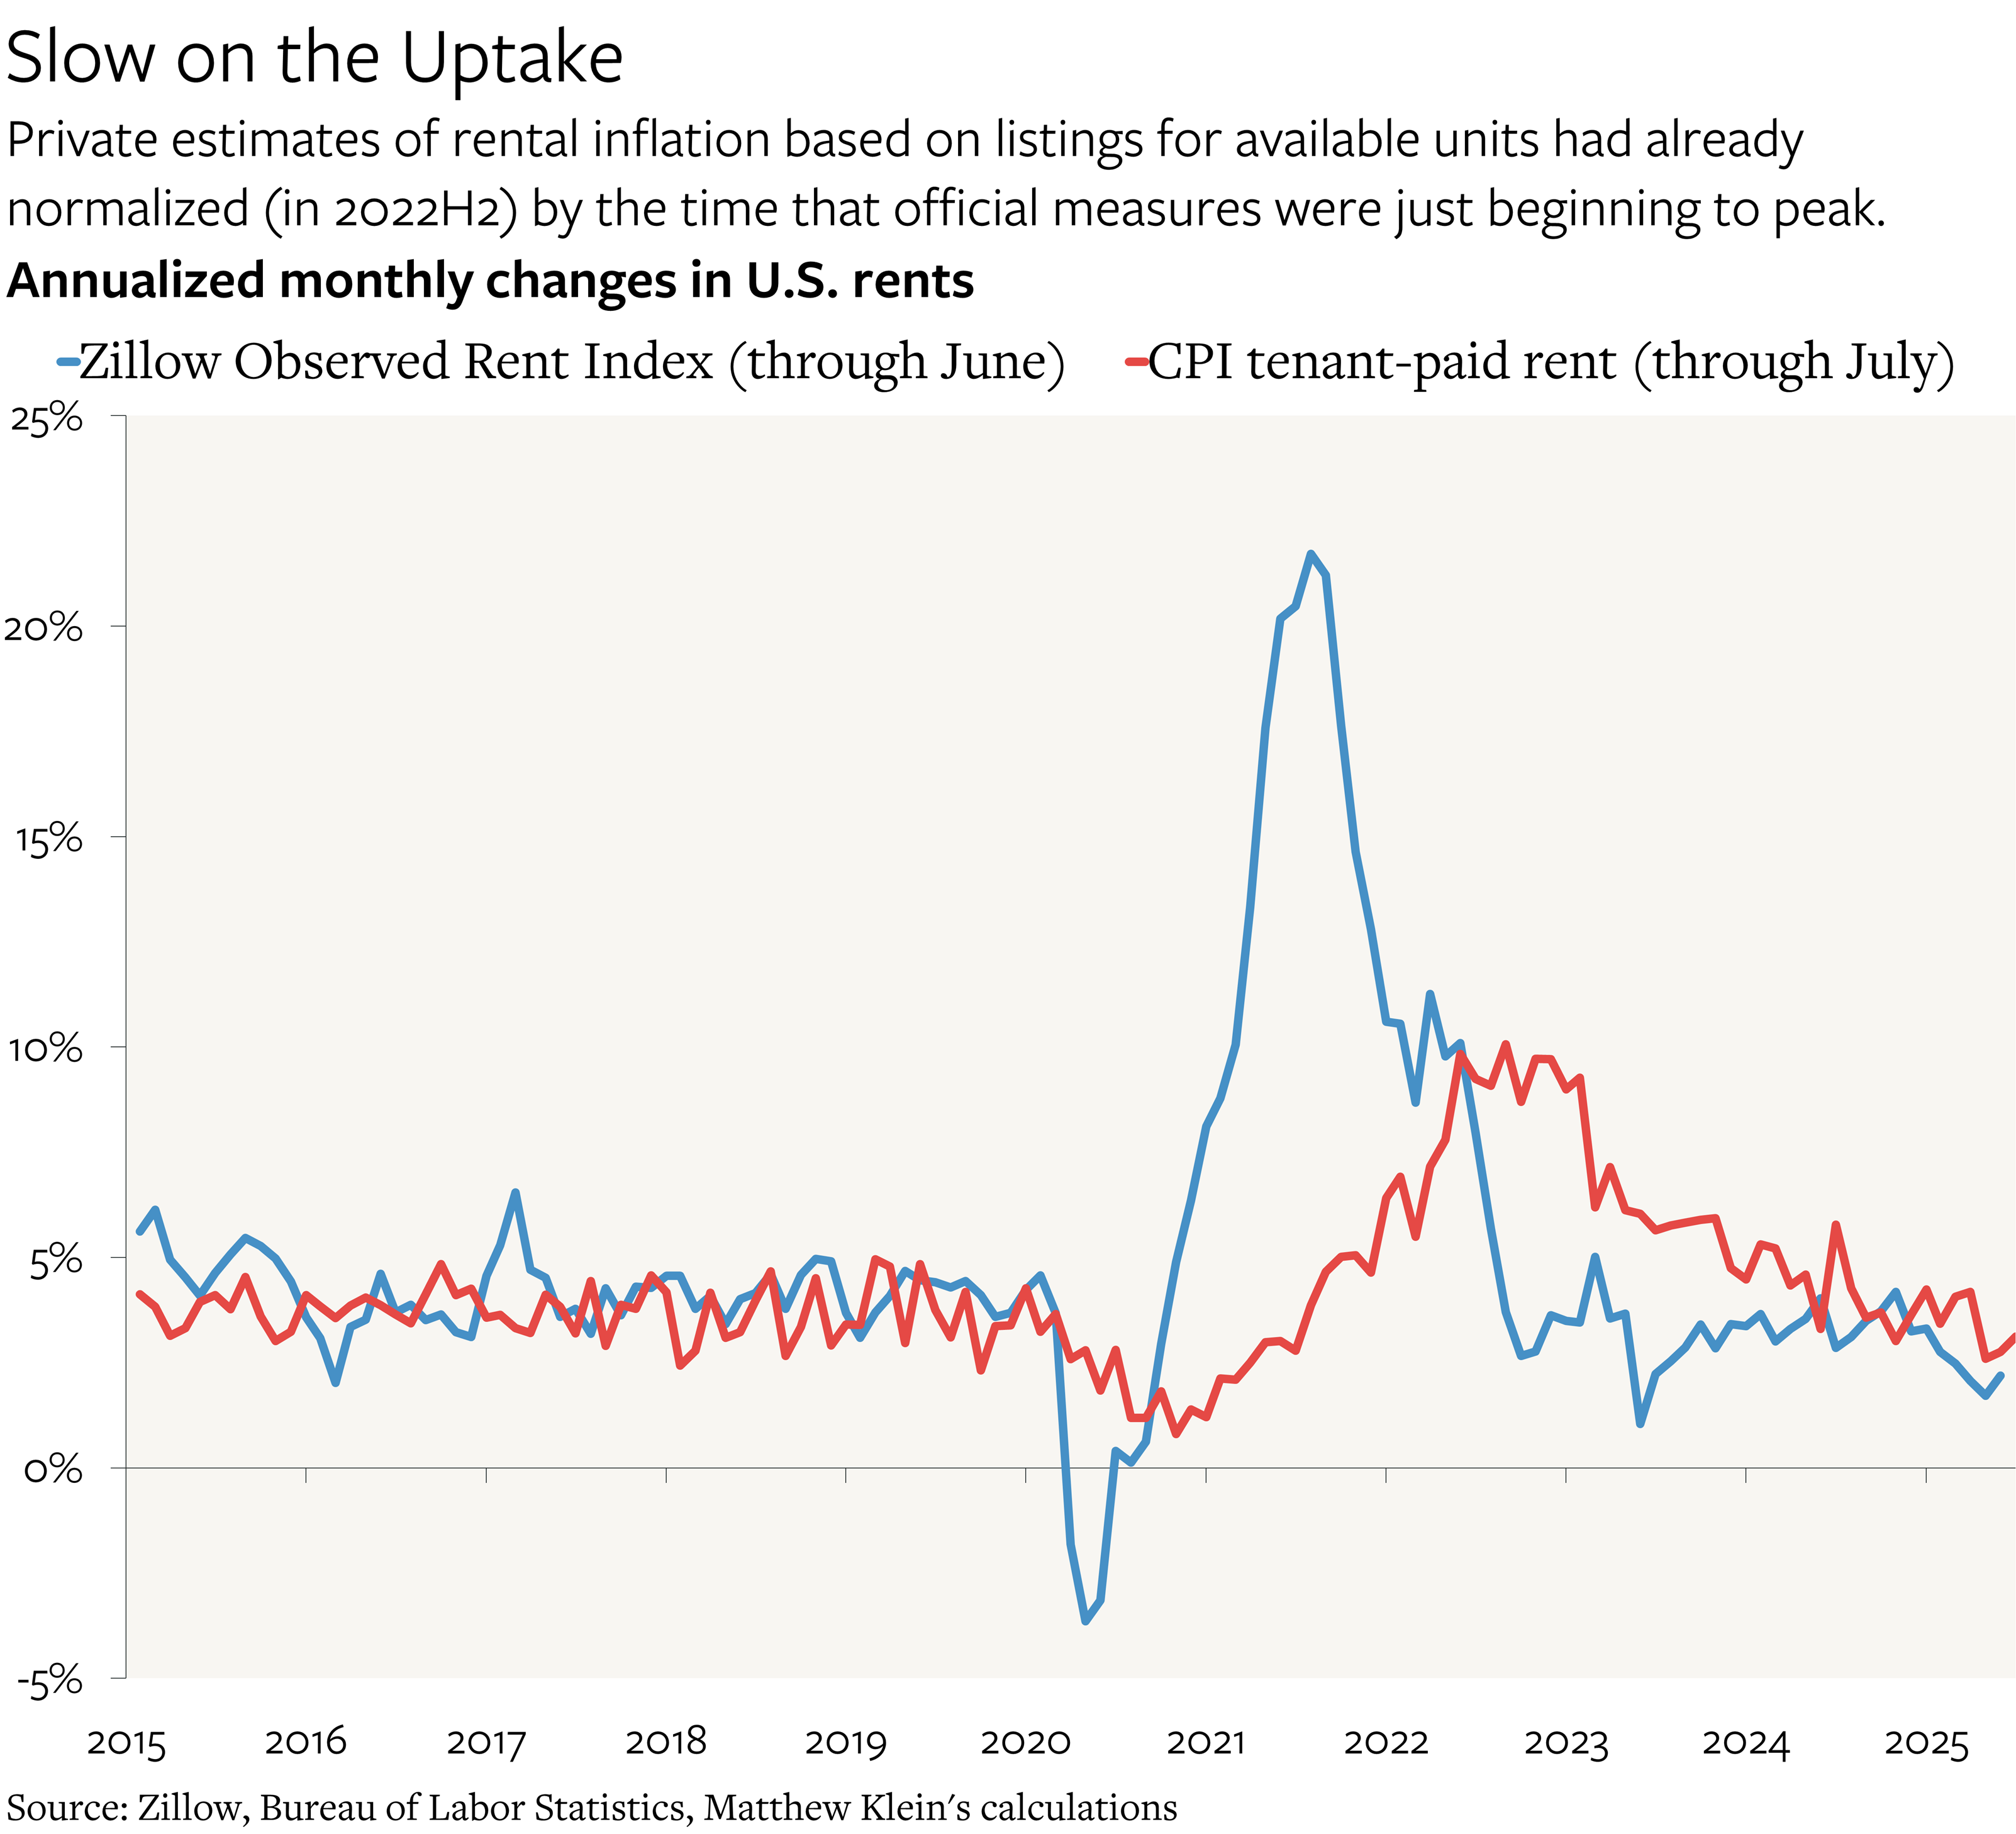
One problem is that much of the alleged slowdown is attributable to the way the BLS measures rents, which is based on signed leases. Since most leases last for 12 months, each sampled unit is checked only once every six months. (All sampled units are divided into cohorts so that rents across the country are still checked every month.) Those numbers are then combined with detailed Census data on the housing stock to estimate what homeowners would have to pay to rent their owner-occupied residences based on size, age, location, amenities, etc.
This methodology was designed to track how much people actually pay (or would pay) for housing at any point in time, and it works well in most circumstances. Most leases last at least one year, most renters renew their leases, and price trends tend to be stable, especially for renewals. But it is, by design, far slower to adjust to changes in economic conditions than estimates that only look at listed rents for available units. During the wild swings of the pandemic and reopening, private-sector estimates of listed rents spiked much earlier and came down much earlier than contract rents. Together, tenant-paid rents and imputed owner-occupied rents make up a third of the entire CPI, which means that these lags—in either direction—can have a large impact.
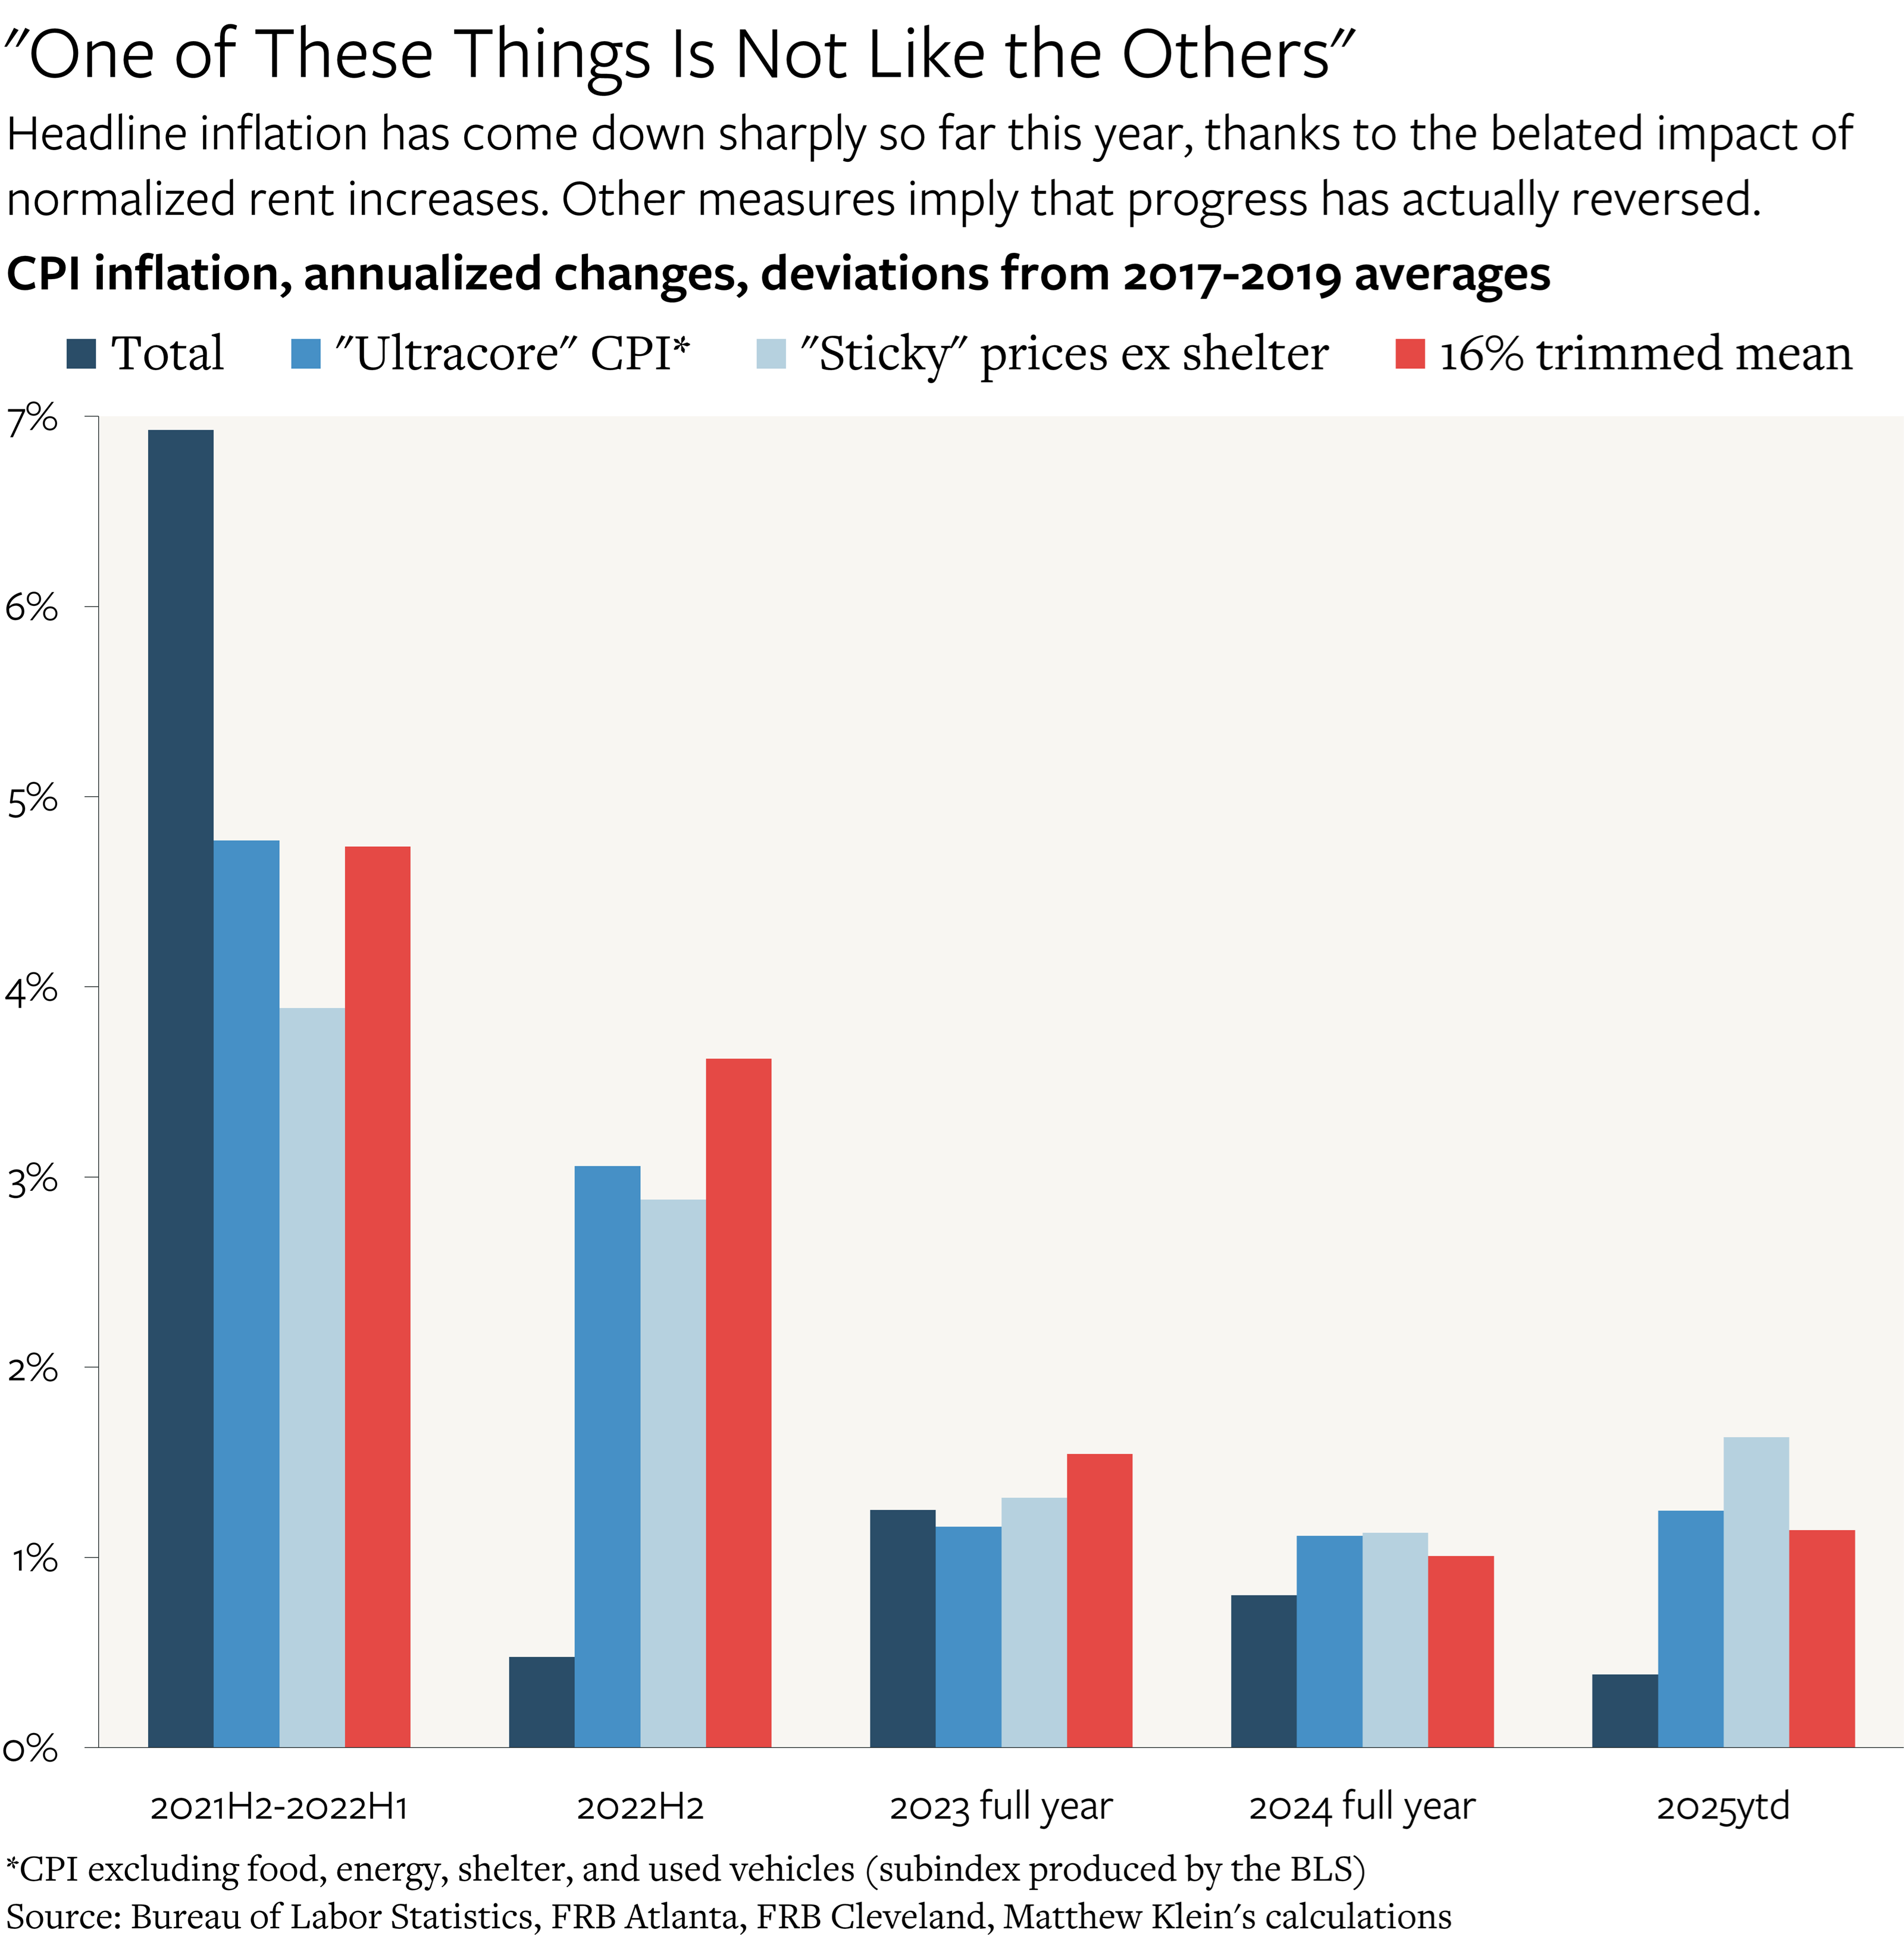
Fed officials have been aware of this issue for years, which is why they started looking at inflation indices that stripped out housing costs back in late-2022. Their belief was that they would get a better understanding of underlying inflationary trends if they excluded components with known lags or other idiosyncratic and volatile behaviors. Running that exercise now makes two things clear: there has been little progress since the end of 2022; and inflation has been running faster in the first 7 months of 2025 than in 2023-2024.
The BLS publishes a version of the CPI that excludes food, energy, shelter (housing+hotels, mostly), and used cars and trucks. The Federal Reserve Bank of Cleveland has a measure that recalculates the monthly change in the CPI excluding the components with the largest price increases and largest price decreases. The Federal Reserve Bank of Atlanta divides the CPI into two groups based on whether prices change frequently or not. They also publish versions of their “sticky-price” CPI excluding shelter. Another approach is simply to focus on select components that ought to representative of the broader whole, such as “full service meals and snacks”, or “personal care services” (mostly haircuts).
Tellingly, all of these measures tend to tell a similar story regarding inflation over the past few years—and this story is very different from what the headline figures have been showing, thanks to the impact of housing.
Some, but only some, of this can be explained by tariffs.