
Is the Market Underpricing the Risk of Fed Hikes?
The incoming data are undermining the case for lowering rates, which means that the 0% implied probability of hikes may be too low. And that is before considering backlash to Trump's attacks.

According to the CME’s FedWatch tool, futures prices as of January 16 implied that there was no chance that the Federal Reserve will raise its short-term interest rate target band from 3.5%-3.75% over the course of 2026. Market prices implied that there was only a 2% chance that the short rate target could rise by the end of 2027, although that may simply reflect wider uncertainty about outcomes nearly two years in the future rather than a considered view on the actual likelihood of that happening. By contrast, the implied probability that the Fed will lower rates by at least 0.25 percentage points over the next 12 months is over 90%.
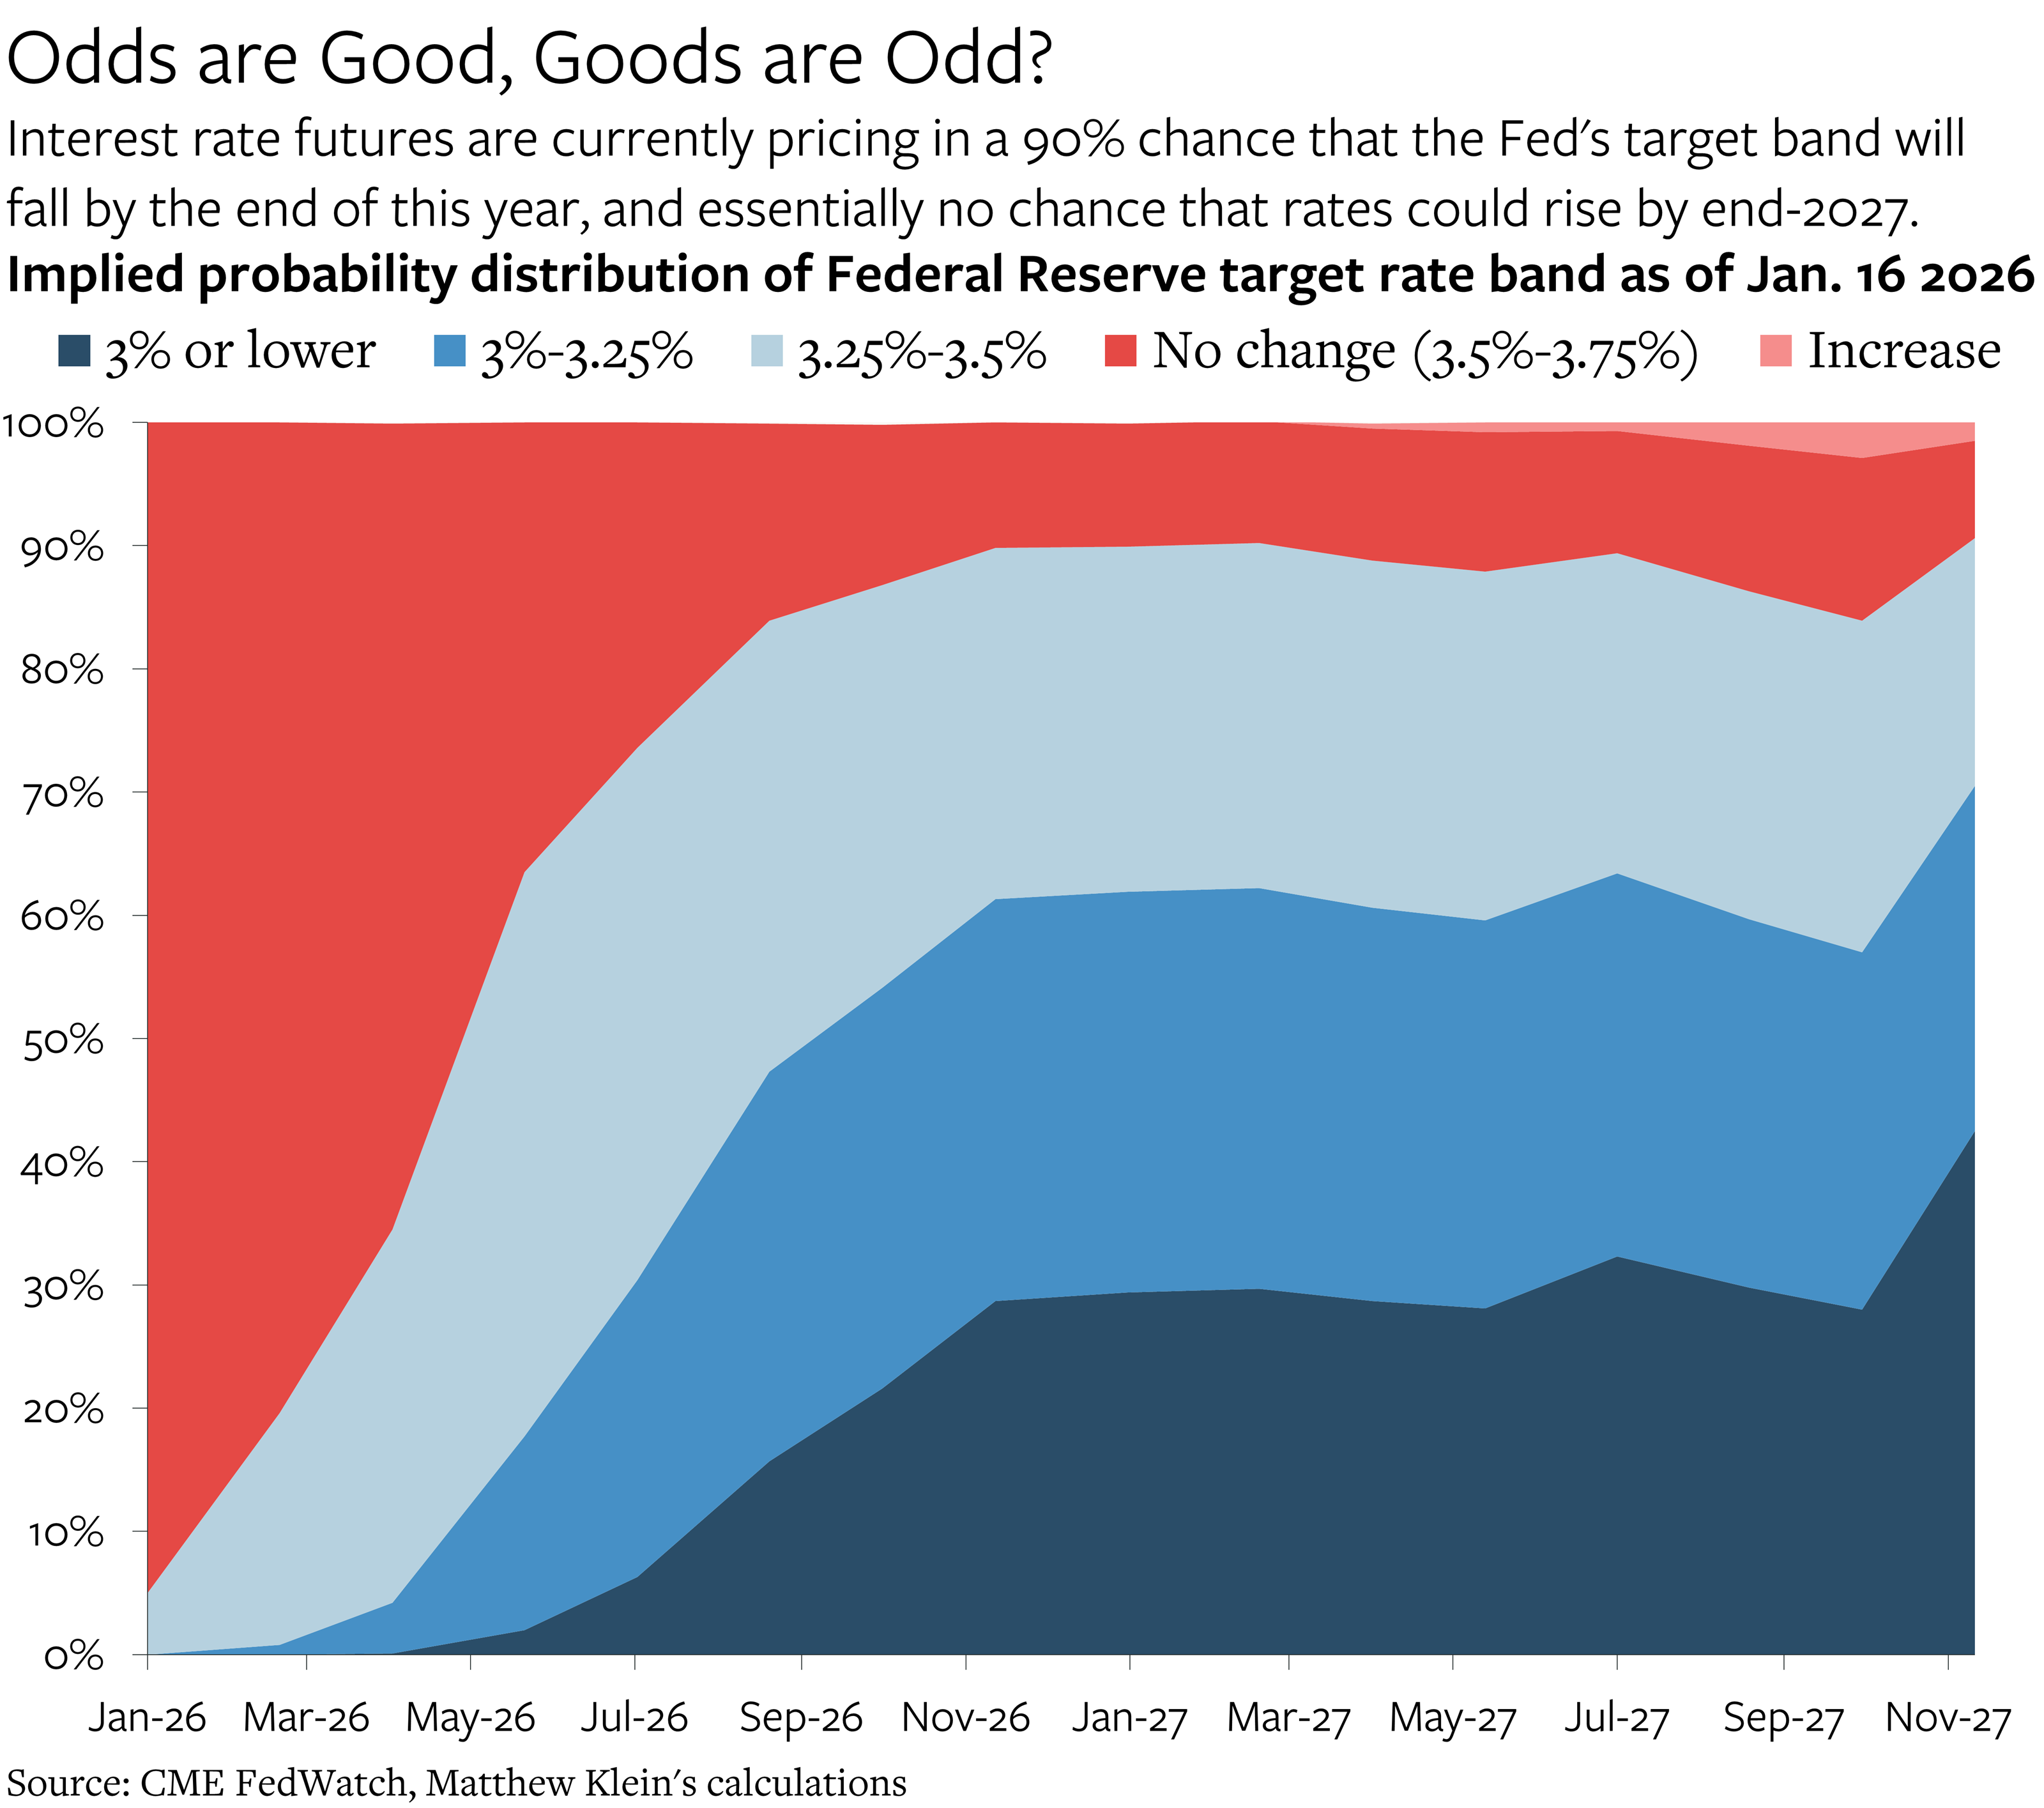
These modal probabilities may prove to be accurate forecasts, especially if the current administration succeeds in suborning the central bank to its whims. (As of January 20, the implied odds of a rate increase by the end of 2027 have increased to almost 6%, possibly as a consequence of financial asset sales by European investors in response to the Trump administration’s wanton aggression over Greenland.) But there are nevertheless good reasons to think that the implied probability of rate increases over the next two years is too low. The latest data on retail spending, on the job market, on inflation, and on household balance sheets are all consistent with an economy that is not obviously in need of lower borrowing costs.
In fact, the big risk is (still) that a reduction in rates could unlock the $16 trillion in un-monetized housing wealth that has built up since the end of 2019, leading to a flood of additional consumer spending. If businesses cannot accommodate all of this extra demand for goods and services by increasing volumes, as seems likely, they would be forced to raise prices, or combine price increases with other methods for rationing supply. Despite repeated statements that policy is “restrictive”, the reality remains that rates have been just high enough to keep spending and production sufficiently in balance to prevent inflation from getting worse. Lower rates threaten to disrupt this precarious situation and reignite inflation just as other policies are making things worse.
The Job Market is Still Strong
The most important feature of the current labor market is that 80.7% of Americans aged 25-54 had a job as of mid-December, which is essentially unchanged from the multi-decade high reached in mid-2023.1
Despite the reported increase in unemployment over the past few years from about 3.5% in early 2023 to 4.4% as of December, and despite the slowdown in aggregate job growth from about 2% annualized in 2023H1 to about 0% in 2025H2, the so-called “prime age” employment rate has been stable at the highs for more than two-and-a-half years. The only time the employment rate has ever been (slightly) higher was in July 1997-April 2001.
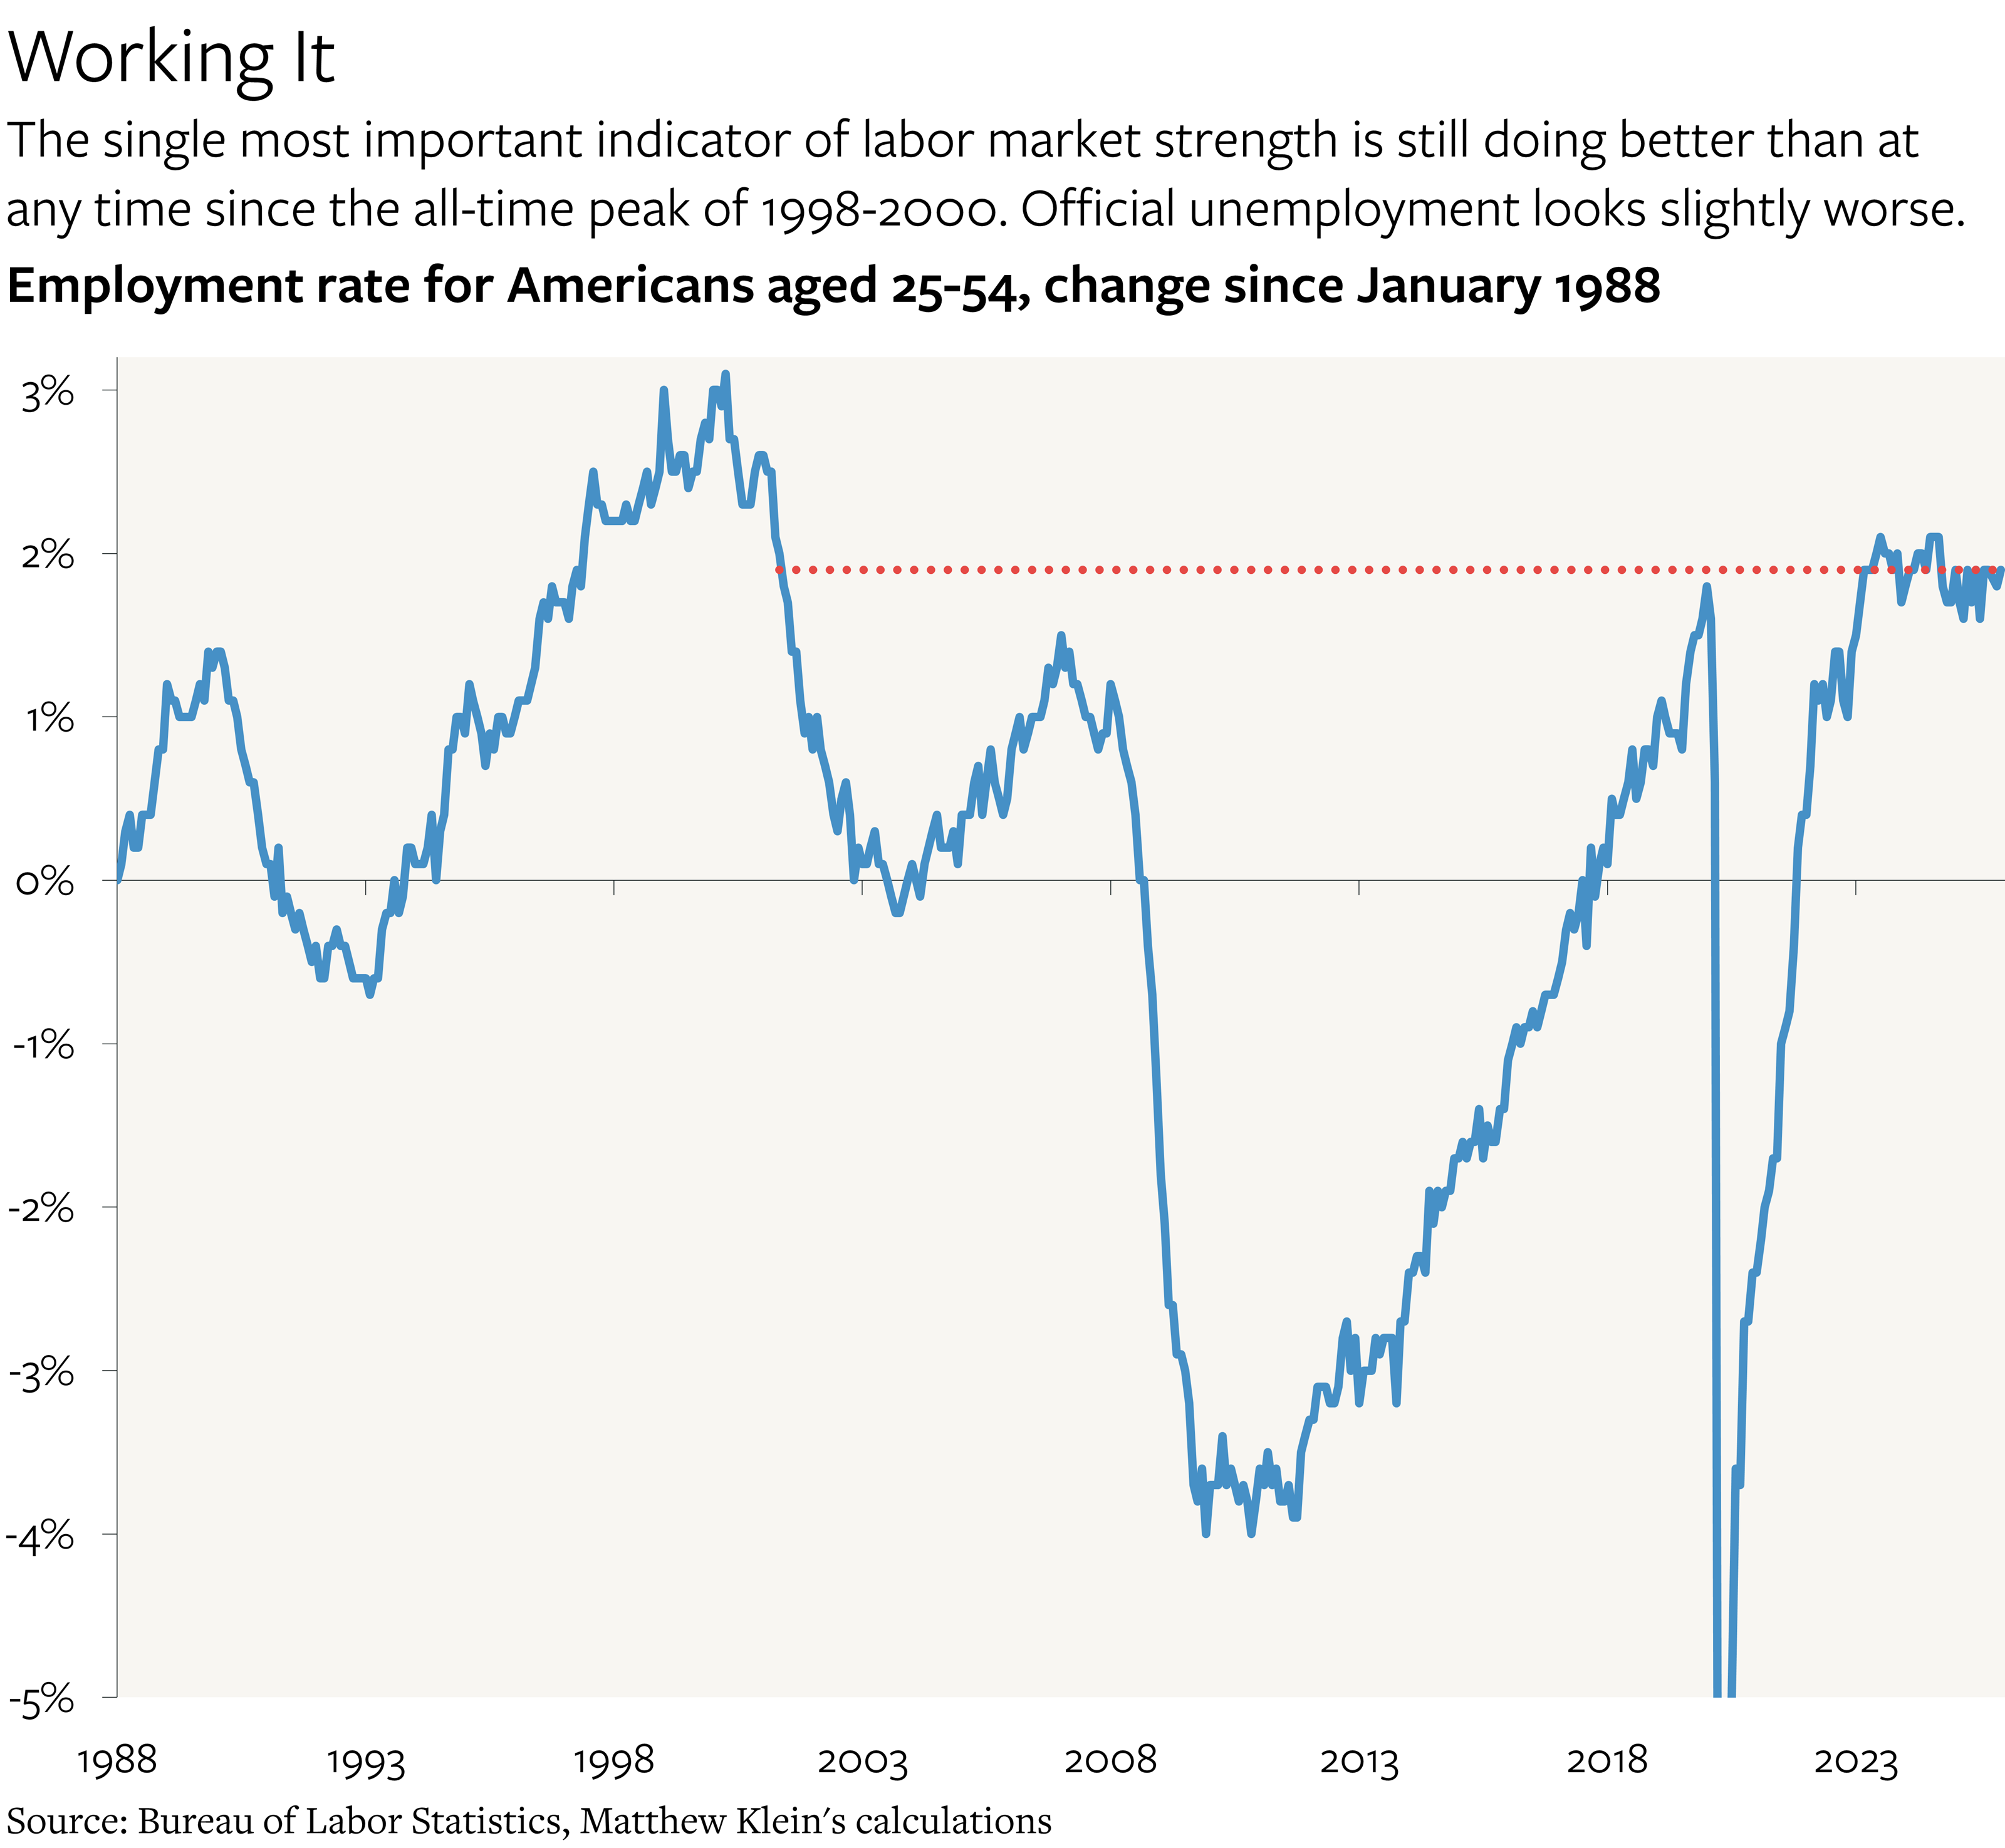
The current situation is the benign inverse of the jobless recovery of the 2010s.
Back then, declines in the headline unemployment rate (U-3) grossly overstated the recovery in the job market, because employment was not rising. Instead, prospective workers were no longer “actively” looking for jobs and were therefore not being counted as unemployed. U-3 peaked at 10% at the end of 2009, when the 25-54 employment rate hit its trough of 75%. By the beginning of 2013—more than three years later—U-3 unemployment had dropped to 7.5%, but the “prime age” employment rate was still under 76%.
Even when U-3 made it to 4.4% by early 2017—the same place it is now, which is down slightly from where it was in September and November—the employment rate for Americans aged 25-54 was still only 78.5%. That was well below the previous peak of 80% reached in 2006Q4-2007Q1, which was also the last time that U-3 hit 4.4%. The employment rate today is more than 2 percentage points higher than it was in early 2017 and almost 1 percentage point higher than in 2006Q4-2007Q1, despite U-3 being the same in all three periods. The difference is that the share of Americans aged 25-54 who were counted as being in the “labor force” is much higher now than in previous episodes, and has increased by about 0.7 percentage points since early 2023.
In other words, the reason why reported unemployment is up modestly from the trough is because a higher share of the people who do not have jobs are “actively” looking for work. As I explained in more detail last month, the official distinction between people who are “unemployed” and people who are “not in the labor force” can be surprisingly stringent. That is also consistent with the fact that most of the increase in reported unemployment is attributable to “labor force entrants” who cannot find jobs. From this perspective, nobody, or at least relatively few people, are actually worse off compared to before.
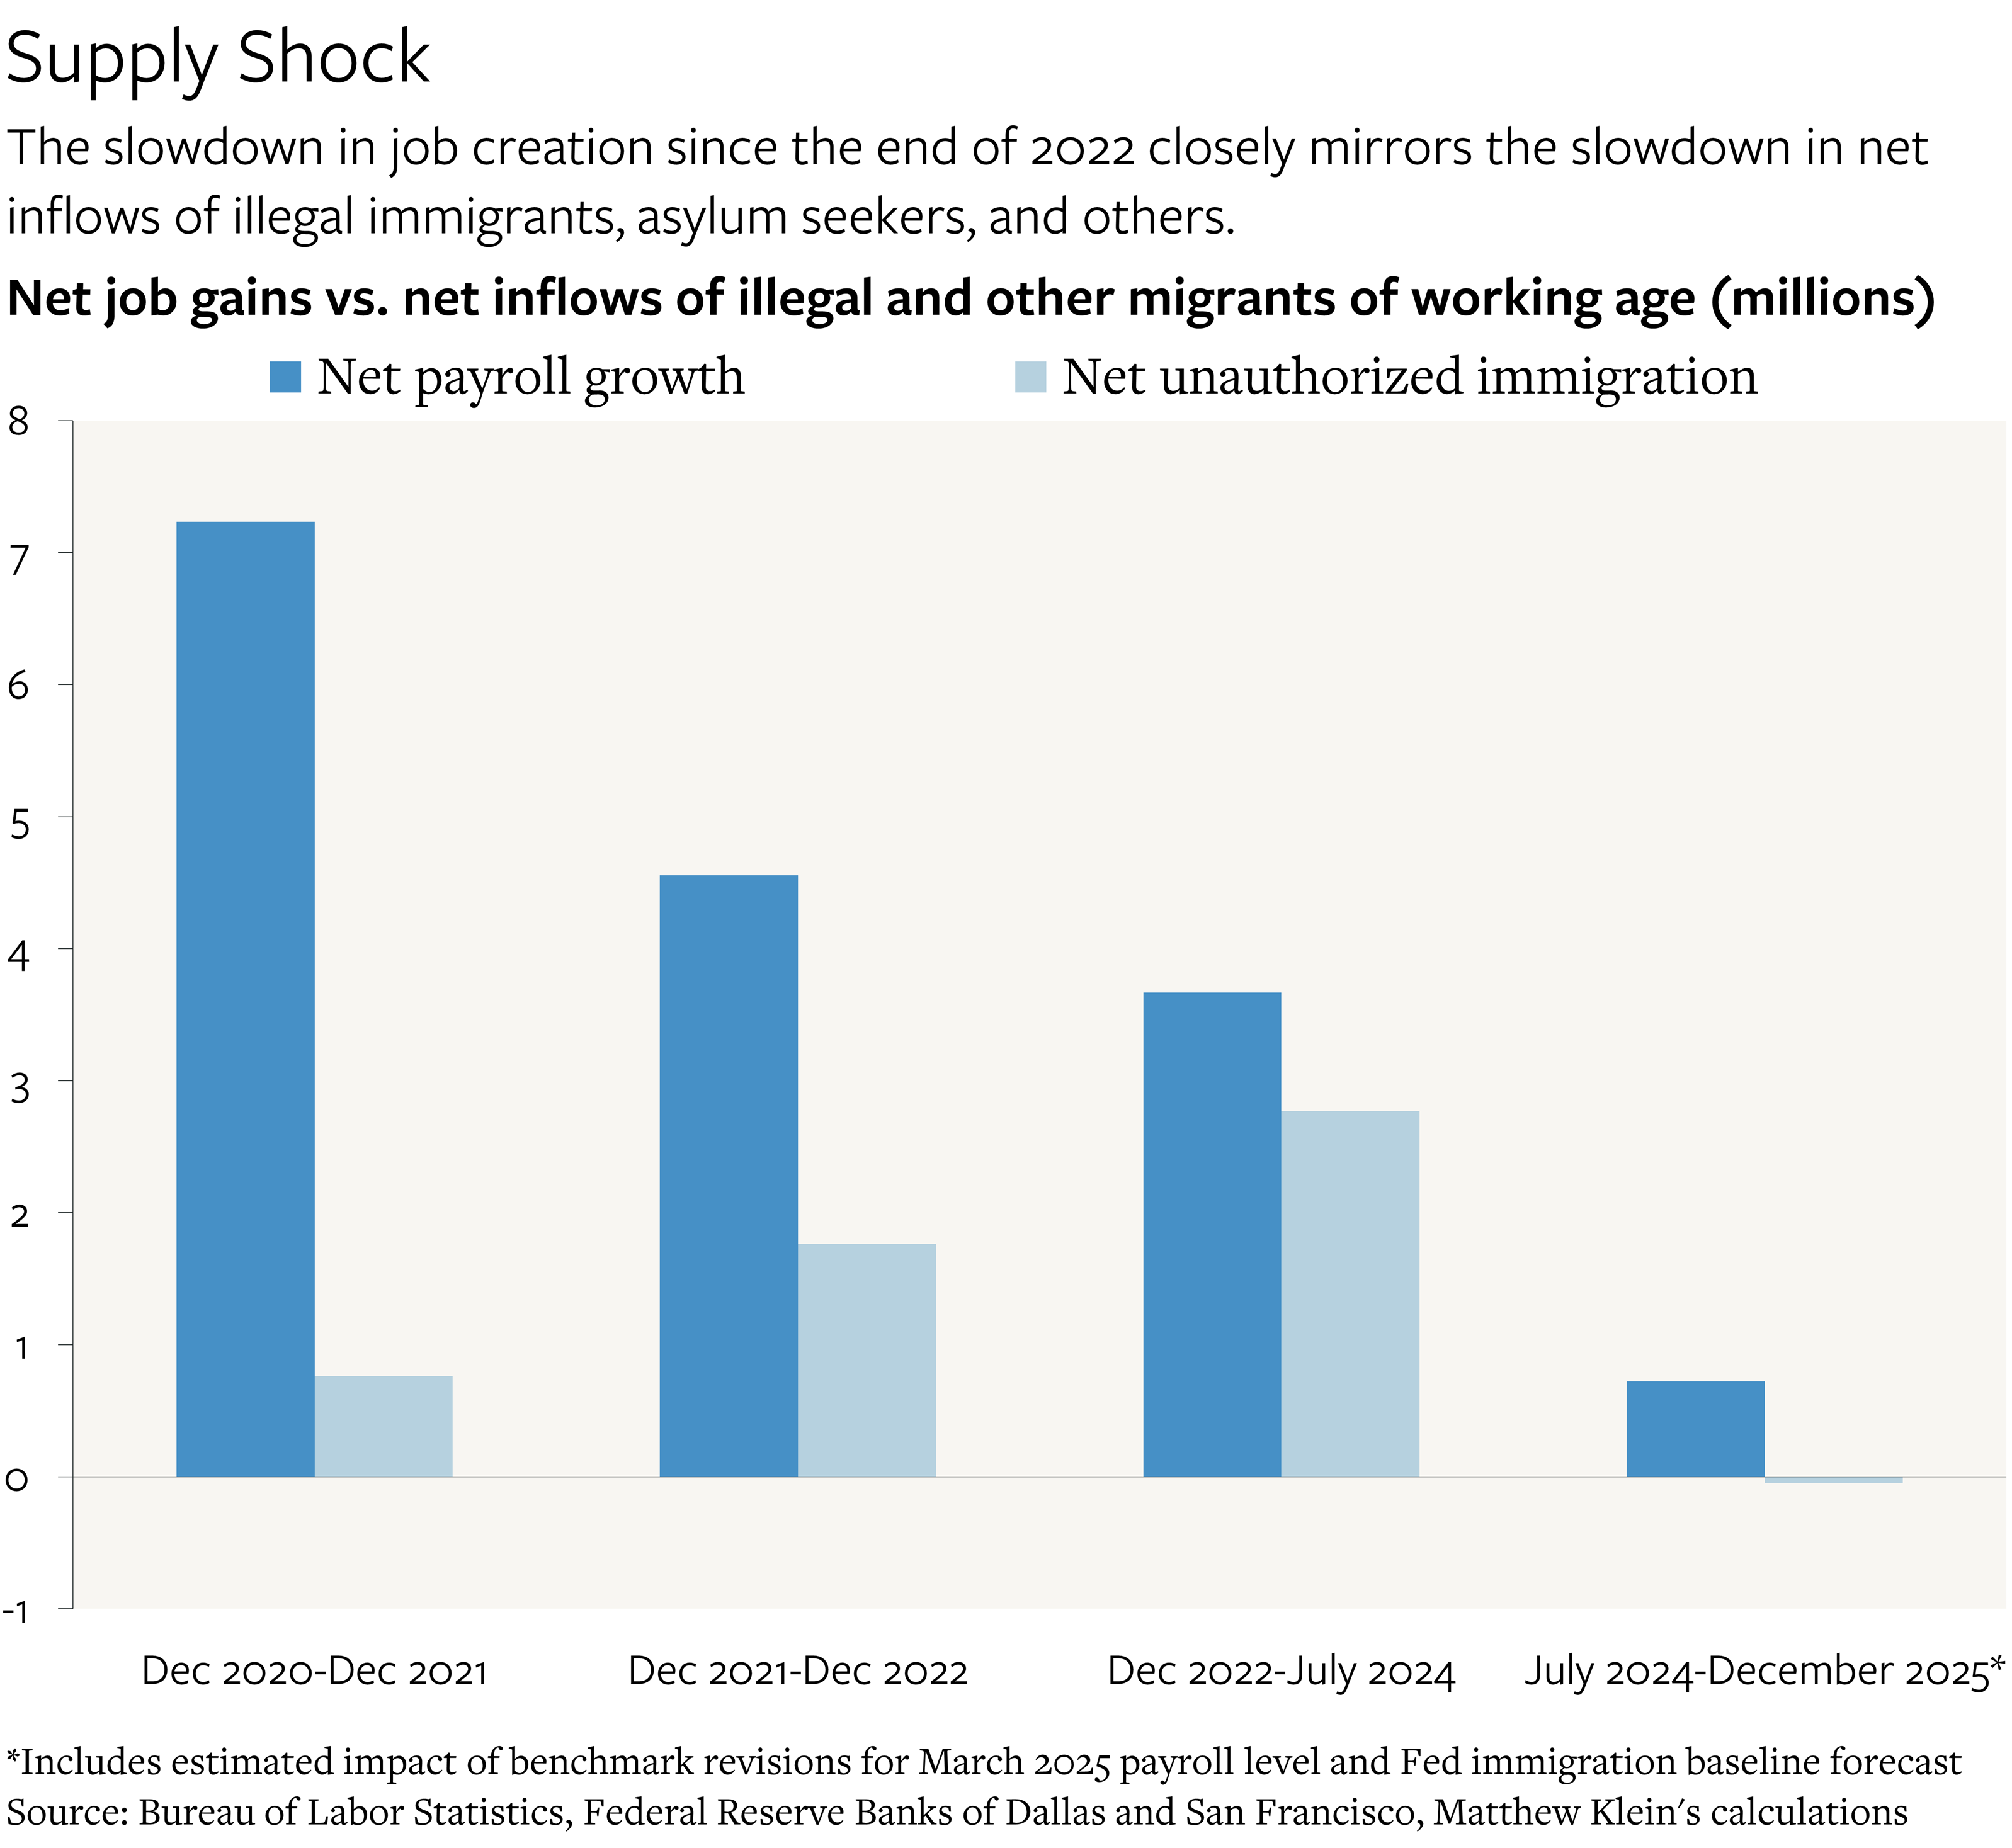
The Net Immigration Swing and Payroll Growth
Meanwhile, the slowdown in job growth, as I explained in more detail back in August, is largely attributable to massive changes in immigration inflows and outflows. These changes began in June 2024, and policy has shifted much more aggressively since then.
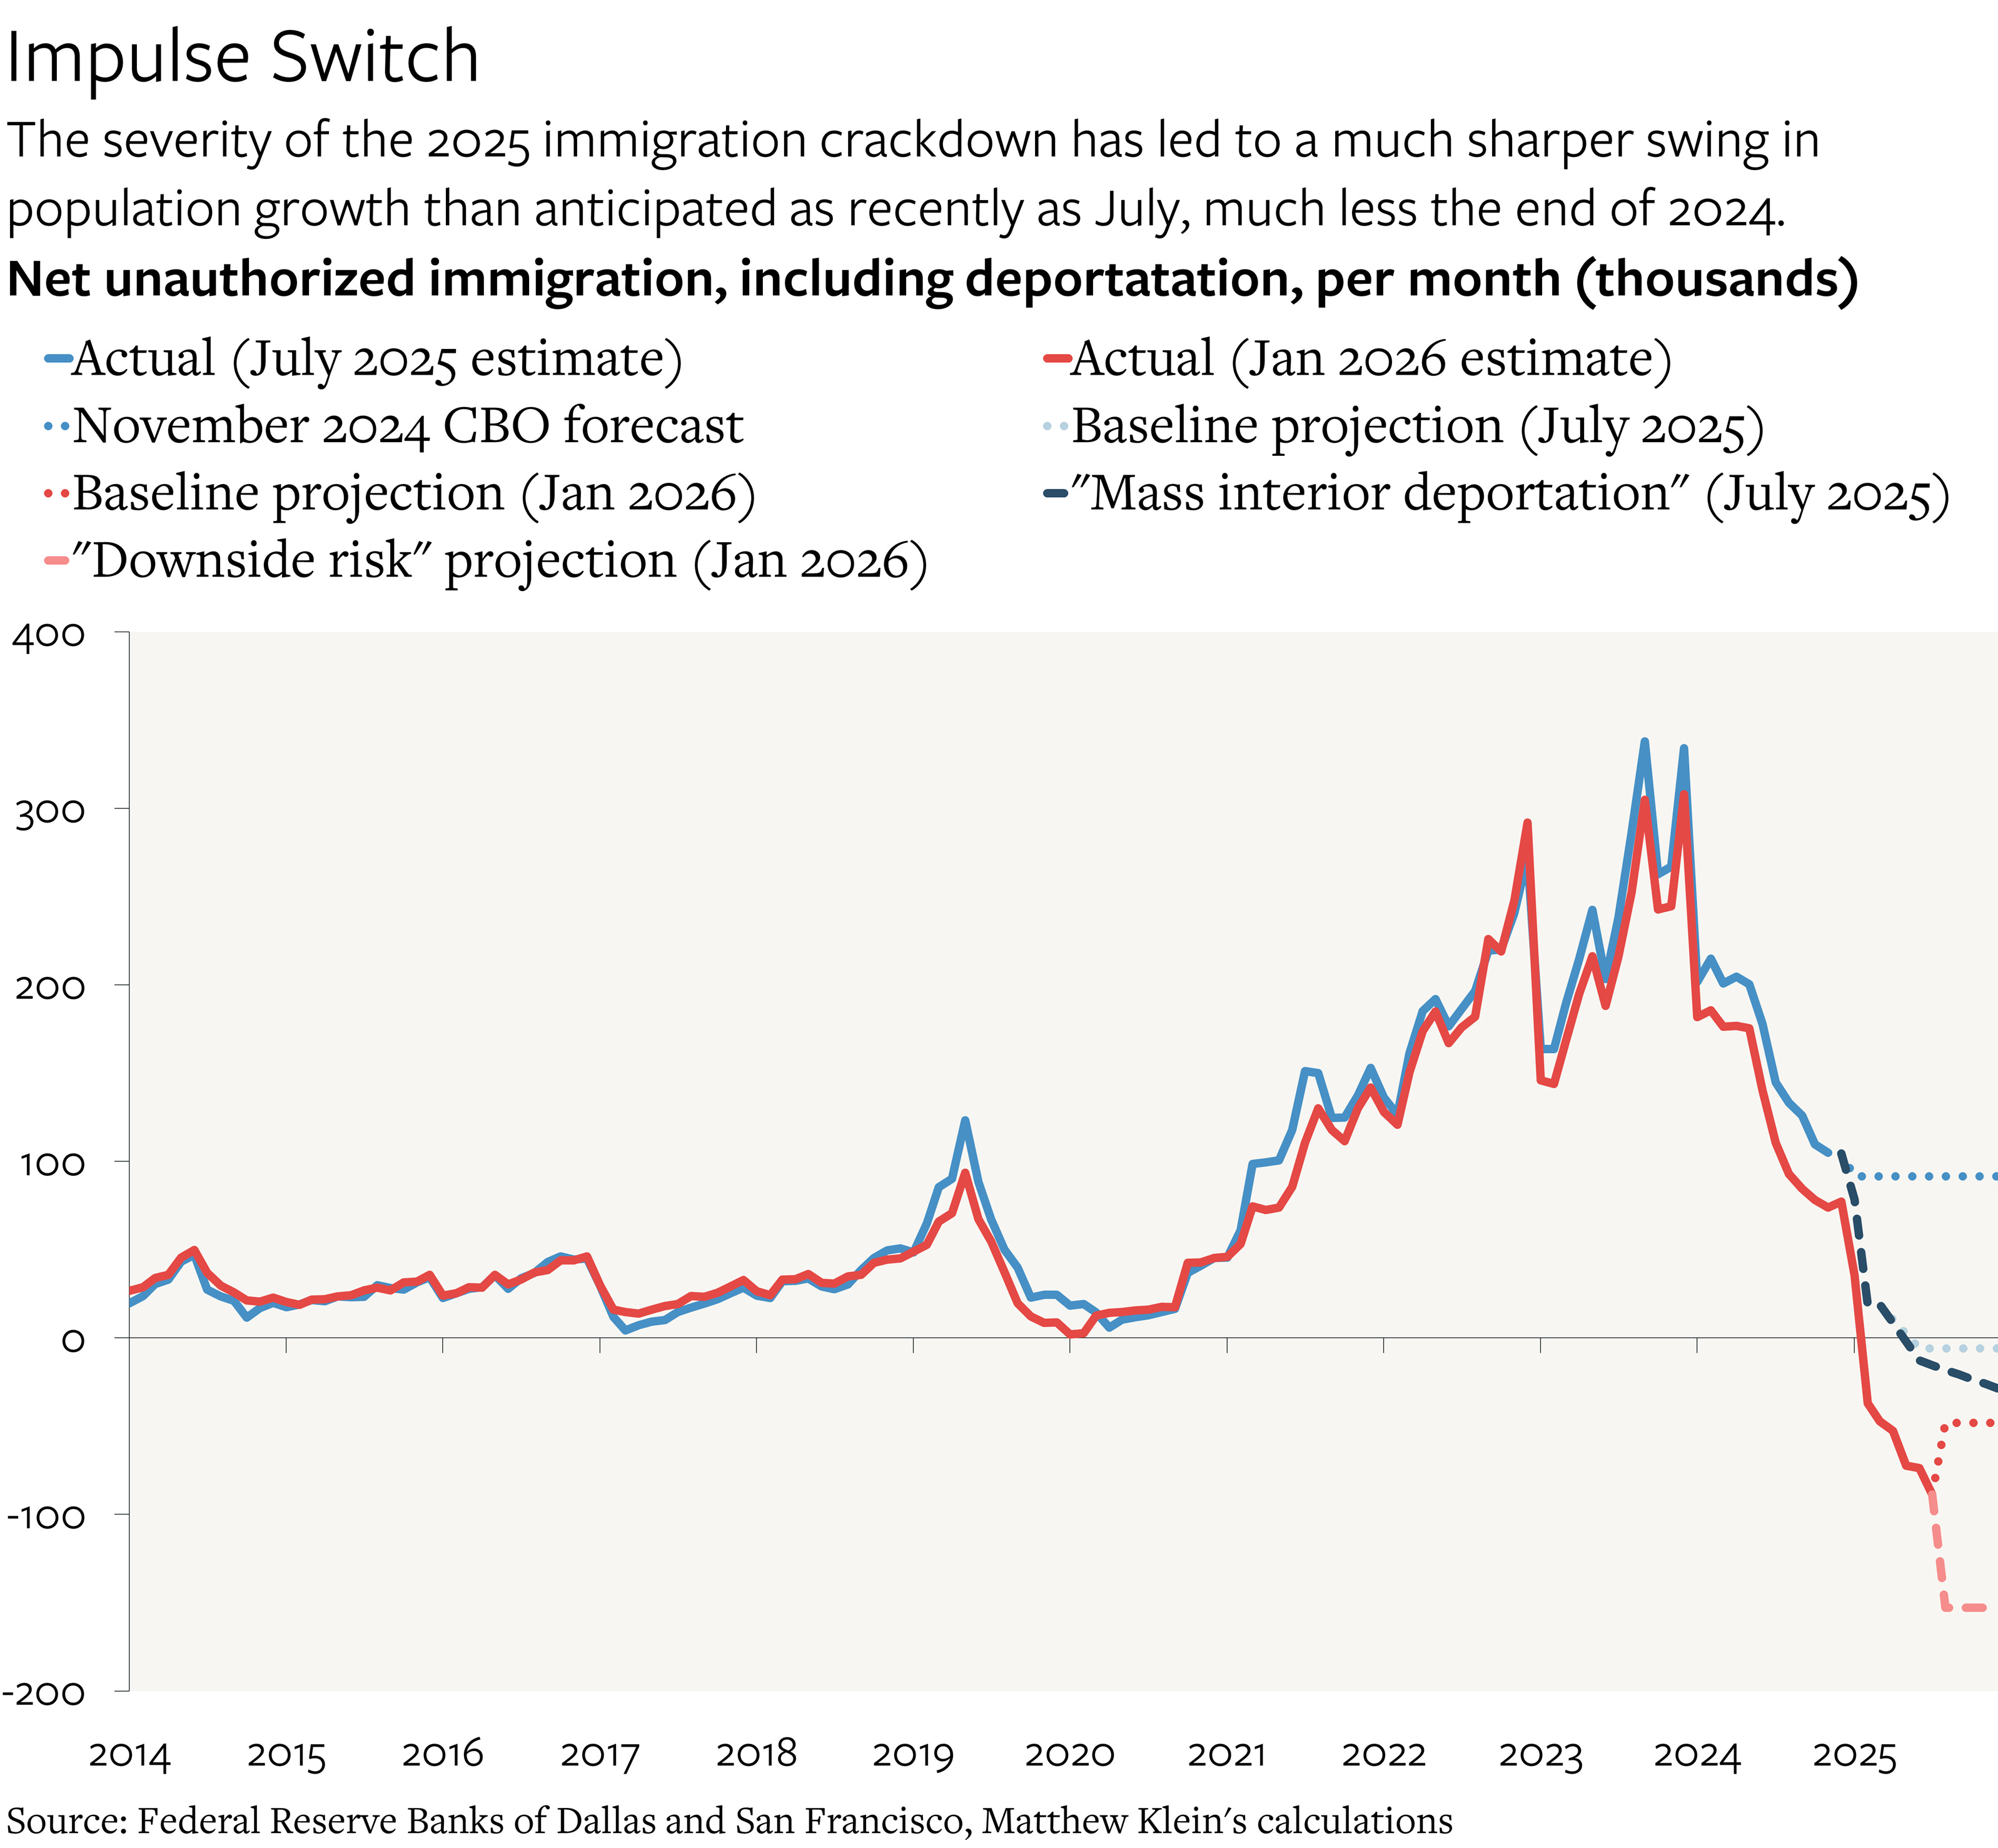
The latest estimates from economists at the Federal Reserve Bank of Dallas and the Federal Reserve Bank of San Francisco imply that net unauthorized immigration, including deportations and “self-deportations”, reduced the U.S. population by 600,000-1.1 million people in 2025, with most of the decline concentrated among people of working age. Net emigration in January-July reduced the U.S. population by 336,000, with deportations and self-deportations having surged from 30,000/month in 2024 to 113,000/month as of July. (Gross inflows were still positive, although down about 92% from the peak in 2023.)
In their baseline scenario, they assume that average monthly net unauthorized immigration in August-December 2025, for which they have no hard data, would be the same as in January-July (about -48,000). Their “downside risk” scenario “assumes the pace of monthly decline continues for the remainder of 2025”, with average net emigration rising to 153,000/month in the last five months of the year.
For perspective, net unauthorized immigration increased the U.S. population by about 2.5 million people each year in 2022 and 2023, and by about 1.5 million in 2024. The Dallas Fed’s previous projection, from last summer, was that net unauthorized immigration in 2025 would boost the U.S. population slightly (by about 88,000 people) and even their “mass interior deportation” scenario projected a net decrease of only 22,000 people in 2025, with monthly net removals slowly rising to 89,000/month by 2028. Current policy is already more severe than what they had anticipated as extreme just a few months ago.
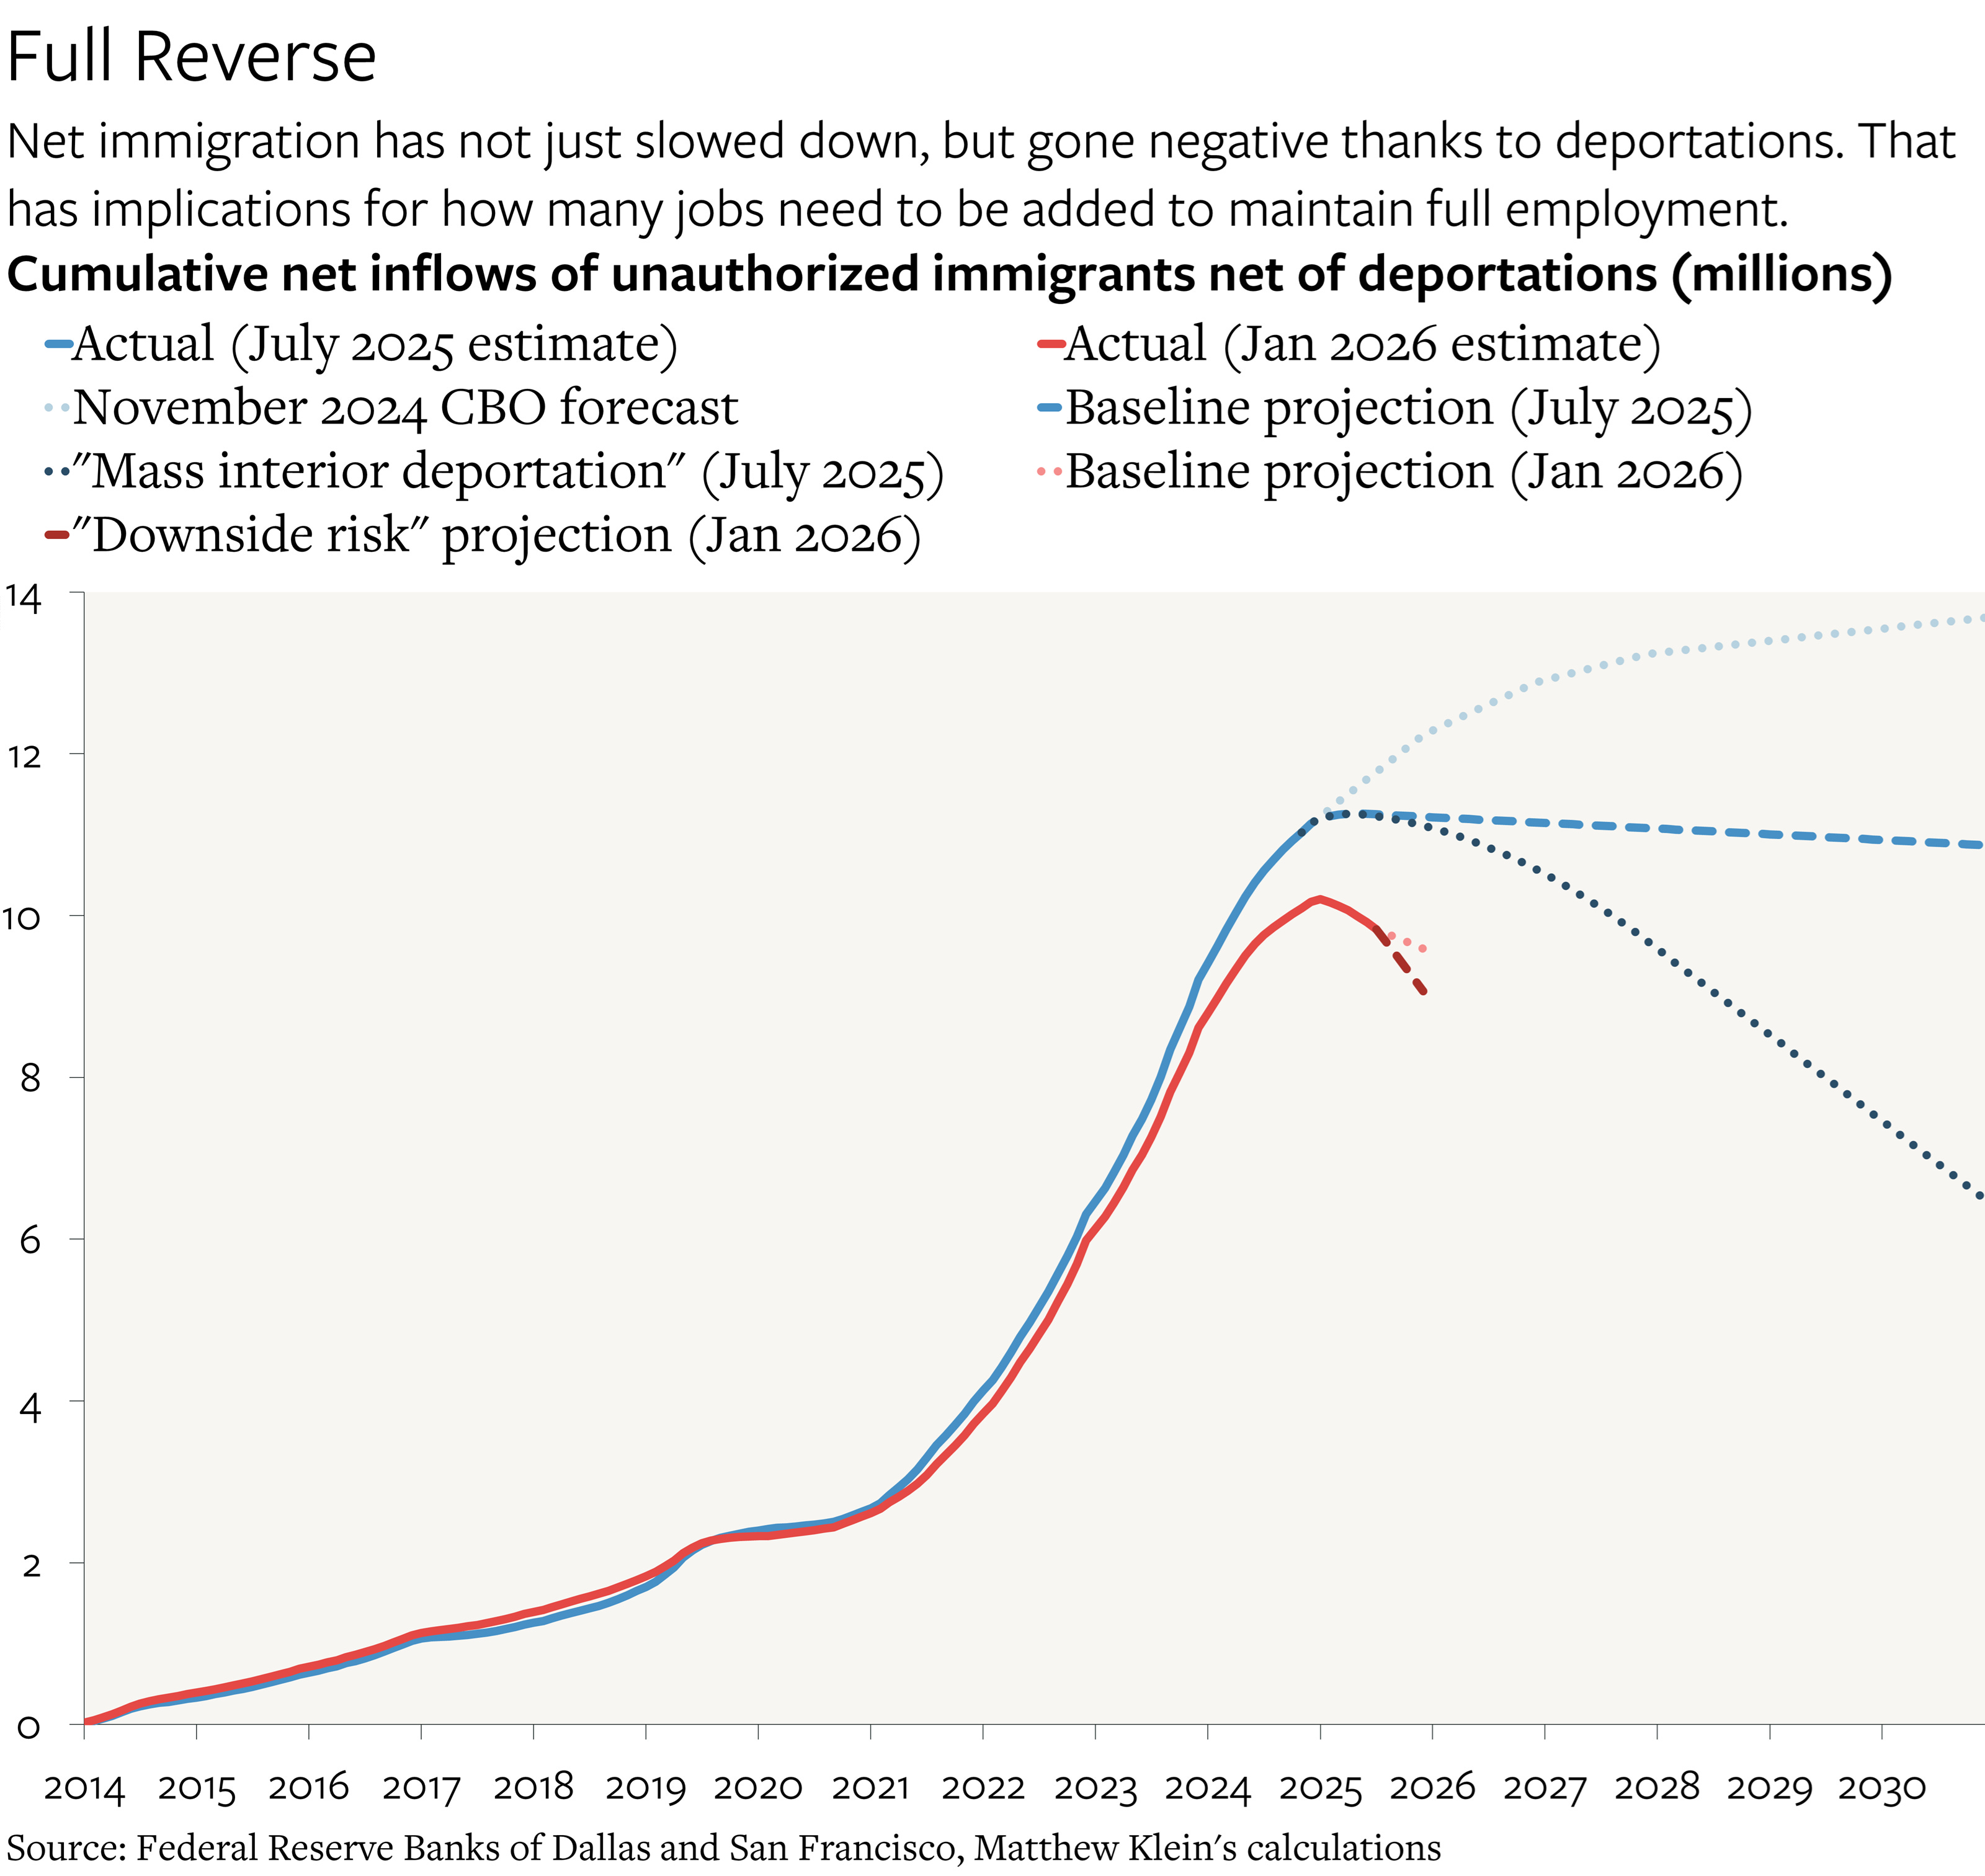
This has implications for employment. According to the estimates from the Dallas and San Francisco Feds, most of the unauthorized immigrants who arrived in 2021-2024 were of working age, while most of the net deportations in 2025 were also of people who were of working age. Many, if not most of those people likely got jobs and contributed to the increase in payroll employment observed during that period. They were also spending what they earned, creating demand for goods and services and encouraging businesses to hire and invest.
The small weakening of the job market that occurred in 2023-2024H1, when the unemployment rate rose modestly and wage growth decelerated slightly, coincided with the period when net payroll growth, while impressive in absolute terms, was relatively low compared to net immigration. By contrast, the more recent period of slow job growth has coincided with zero net immigration of working-aged adults.
The hurdle rate for what constitutes a “good jobs number” has therefore plunged over the past 18 months and may already be negative. That in turn has implications for the trajectory of wage growth and spending, which should have implications for monetary policy.