The Inflation Outlook Is Getting Better, But Also Worse?
Services prices might be moderating, but input costs for manufactured goods may be going the wrong way despite weakening consumer demand.
The latest batch of U.S. data on spending, prices, and production suggests that inflationary pressures may be shifting (slowly) from services back to goods—despite weakening demand. If so, this would be a marked reversal from the dynamics of the past two years.
Headline Holding Patterns
Consumer prices have been rising much faster in 2024 than in the second half of 2023. At first, this was attributed to an unusual one-month jump in the Consumer Price Index (CPI) in January. But the pattern has persisted through April—and it looks worse after excluding idiosyncratic or unusually volatile items.
I still suspect that this apparent acceleration is a mirage that offsets the “fake disinflation” of 2023H2. Looking under the hood provides us with a more complicated picture.
The Good News On Services
The largest single component of the CPI is housing, and while aggregate housing costs tend to rise in line with incomes, changes in supply also matter. In 2020-2022, builders had been constrained in their ability to add housing units to the market because of labor and materials shortages, leading to unusually long delays in both single-family and, especially, multifamily housing completions. That is now over, and the volume of new supply hitting the market has been surging.
So far this year, monthly housing completions have been running 16% faster than in 2021-2022, 25% faster than in 2019, and 35% faster than in 2017-2018. The uptick had initially been concentrated in multifamily production, but has since spread to single-family units as well. (Which is just as well considering that multifamily starts and permits have come off their post-pandemic highs.)
This is already showing up in the private sector data on listed rents, and is also filtering down into the CPI measure of signed leases for new and renewing tenants.1 According to the Bureau of Labor Statistics (BLS), which compiles the numbers, tenant-paid rents have been rising at an annualized rate of 4.9% so far this year. That is only 1.2 percentage points faster than the 2015-2019 average, down from a recent peak of 9.6% a year. “Owners’ equivalent rent”, which reweights actual contract rents according to the owner-occupied housing stock, is still running a bit faster (5.7% a year), but has also slowed markedly over the past year.
Many officials stopped paying close attention to the housing inflation numbers years ago, but there are other indicators that services inflation has either normalized or is close to normal.
The Producer Price Index (PPI) tracks what businesses operating in the U.S. charge to their customers, and organizes each product and industry based on where it sits in a four-stage production chain. These intermediate input costs do not directly relate to consumer prices, but they are nevertheless indicative of inflationary pressures across the economy. So it is encouraging that inflation in business services—from legal fees, to advertising, to utilities—seems to have fully normalized.
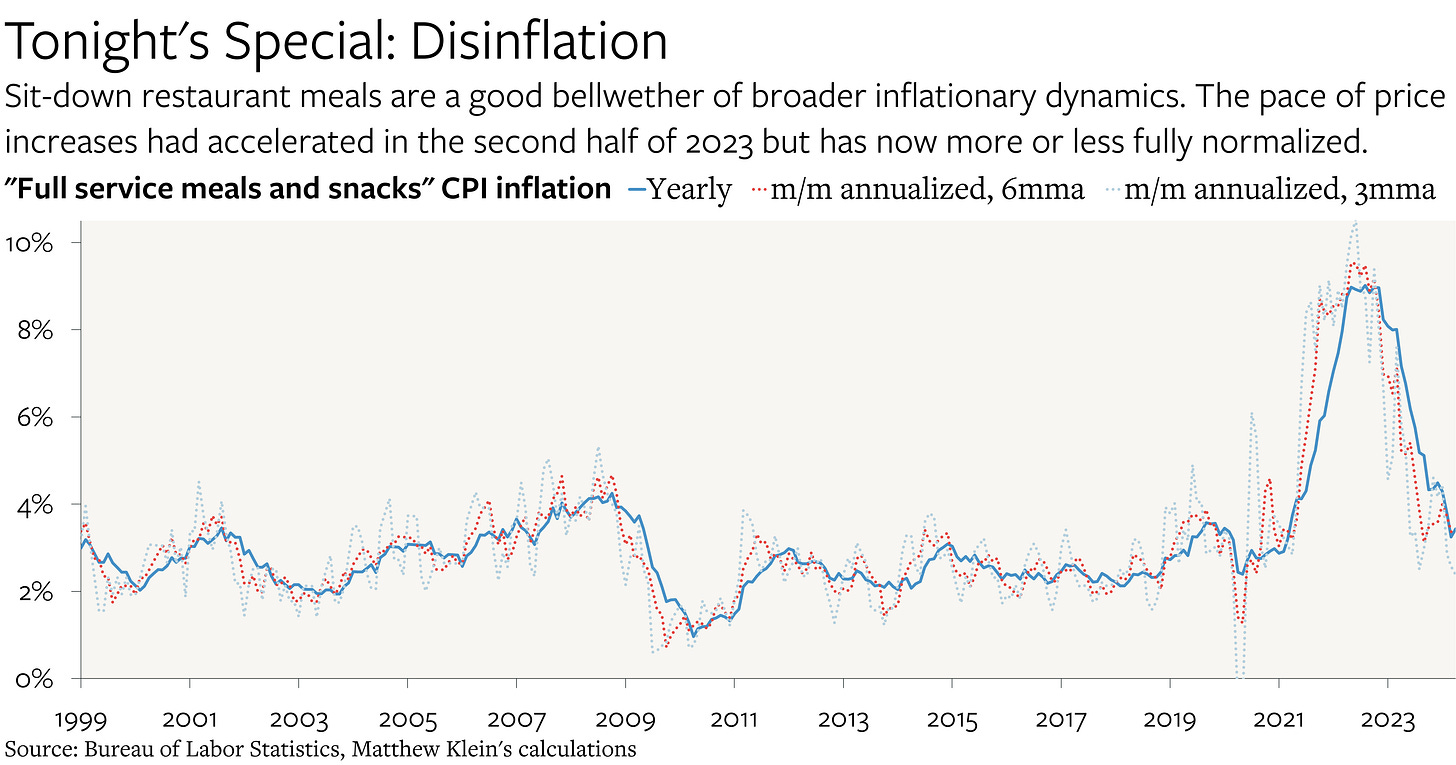
Even more relevant for consumers has been the remarkable (and recent) disinflation in sit-down restaurant prices. “Full service meals and snacks” are discretionary purchases where the main inputs are labor and local rents, plus durable equipment and a few commodities. No single category is as representative of domestically-generated inflationary pressures, which is why the recent slowdown in this segment of the inflation basket is so encouraging.
Combined with the tentative indications that nominal wage growth may have finally begun to decelerate, there is reason to think the long-awaited slowdown in services inflation is in sight.
The Bad News on Goods
Unfortunately, this progress may be partly offset with a reversal in the disinflationary impulse that had been coming from goods.


