The Rich Have all the "Excess" Cash Now
The latest estimates imply that the highest-income Americans are holding almost all of the extra cash, but lower borrowing and higher asset purchases mean that balance sheets are still improving.
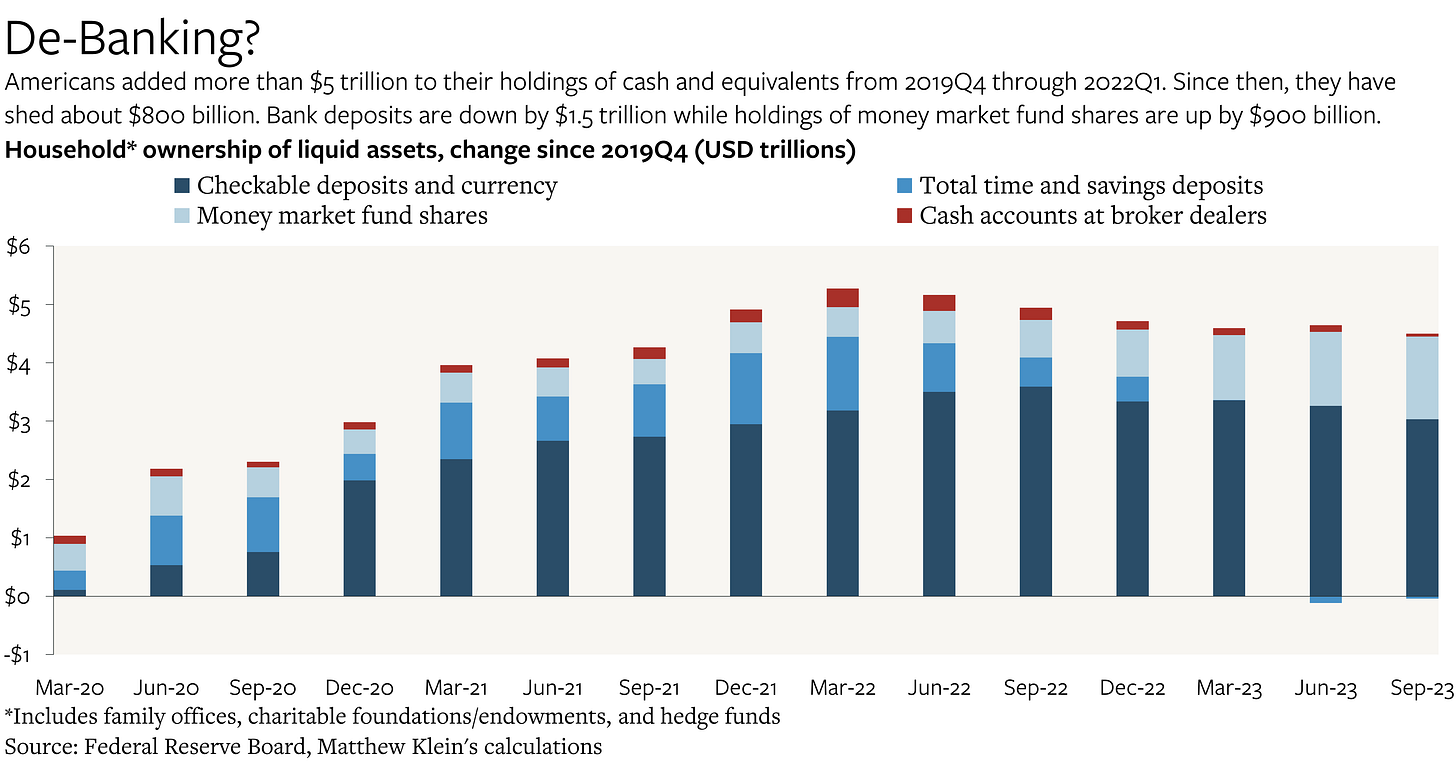
Americans’ holdings of cash and equivalents—physical currency, bank deposits, money market fund shares, and cash in brokerage accounts—have fallen by just over $800 billion since the peak in 2022Q1. But this aggregate conceals considerable variation across income groups, with Americans in the top 1% of the distribution adding about $200 billion (4%) to their cash holdings since 2022Q1 even as everyone else shed about $1 trillion. This has implications for questions about “excess” savings and the potential for that dry powder to finance additional consumer spending above and beyond income growth.
Where “Excess” Savings Came From
Americans cut their spending sharply during the pandemic even as incomes rose thanks to government support. The result was a savings windfall worth about $2.3 trillion above and beyond what would have been expected from pre-pandemic trends.
While some of this “excess” saving took the form of lower borrowing and higher spending on housing and durable goods, the biggest change was a surge in Americans’ holdings of money-like assets from $14.3 trillion in 2019Q4 to $19.6 trillion by the peak in 2022Q1.
I have covered this at length in previous notes, although some of the more detailed claims have been rendered obsolete thanks to revisions.
Inside America's household savings boom — July 12, 2021
Are America's "Excess" Savings Here to Stay? — January 10, 2022
Where Have the "Excess" Savings Gone? — January 12, 2022
America's "Excess Savings" Are Going Away. Inflation Is Not. — June 30, 2023
"Excess" Savings Are Higher Now (Sort Of): More Highlights from the 2023 Comprehensive NIPA Revisions — October 4, 2023
What follows is my latest look at the situation, based on the Federal Reserve’s most recent release (for 2022Q3).
Importantly, these newest estimates are the first ones to incorporate results from the 2022 Survey of Consumer Finances (SCF). All of the Fed’s distributional estimates of household assets and liabilities until now had been based on models calibrated to older vintages of the SCF, which only comes out once every three years. In other words, everything we thought we knew about saving and borrowing at anything other than the highest level of aggregation was nothing more than an educated guess based on numbers from 2019Q3 and historical relationships.1
The first thing to note is that almost the entire pool of “excess” cash is now effectively held by American households in the top 1% of the income distribution. (Households with income of at least $1.2 million/year in 2022Q3, according to the Fed.) At the peak in 2022Q1, the top 1% of households by income only held about 38% of Americans’ total “excess” cash and equivalents.


