
Inside America's Consumption Recovery
High earners monetizing asset price gains are always important, but they are far from single-handedly keeping America out of a downturn.

After a worrying pause in the first half of the year, the U.S. consumer is back. And, as of now, the best available data suggest that the rebound is relatively broad-based. Richer consumers have been playing a large role—as they always do thanks to their large share of national income—but their contribution is not unusually outsized compared to prior periods. Crucially, Americans across the income distribution are (still) in their best financial shape in decades. Fears of a fragile “K-shaped” consumption boom dependent on soaring stock prices are misplaced.1
This note will focus on five sets of data: relative stock market returns, the distributional financial accounts; the distribution of disposable personal income, personal consumption, and personal saving; the detailed monthly components of consumer spending; and surveys of consumers that disaggregate results by income level. If the email gets cut off, please click the title at the top to read it on the website.
The Growth Re-Acceleration and the Stock Market
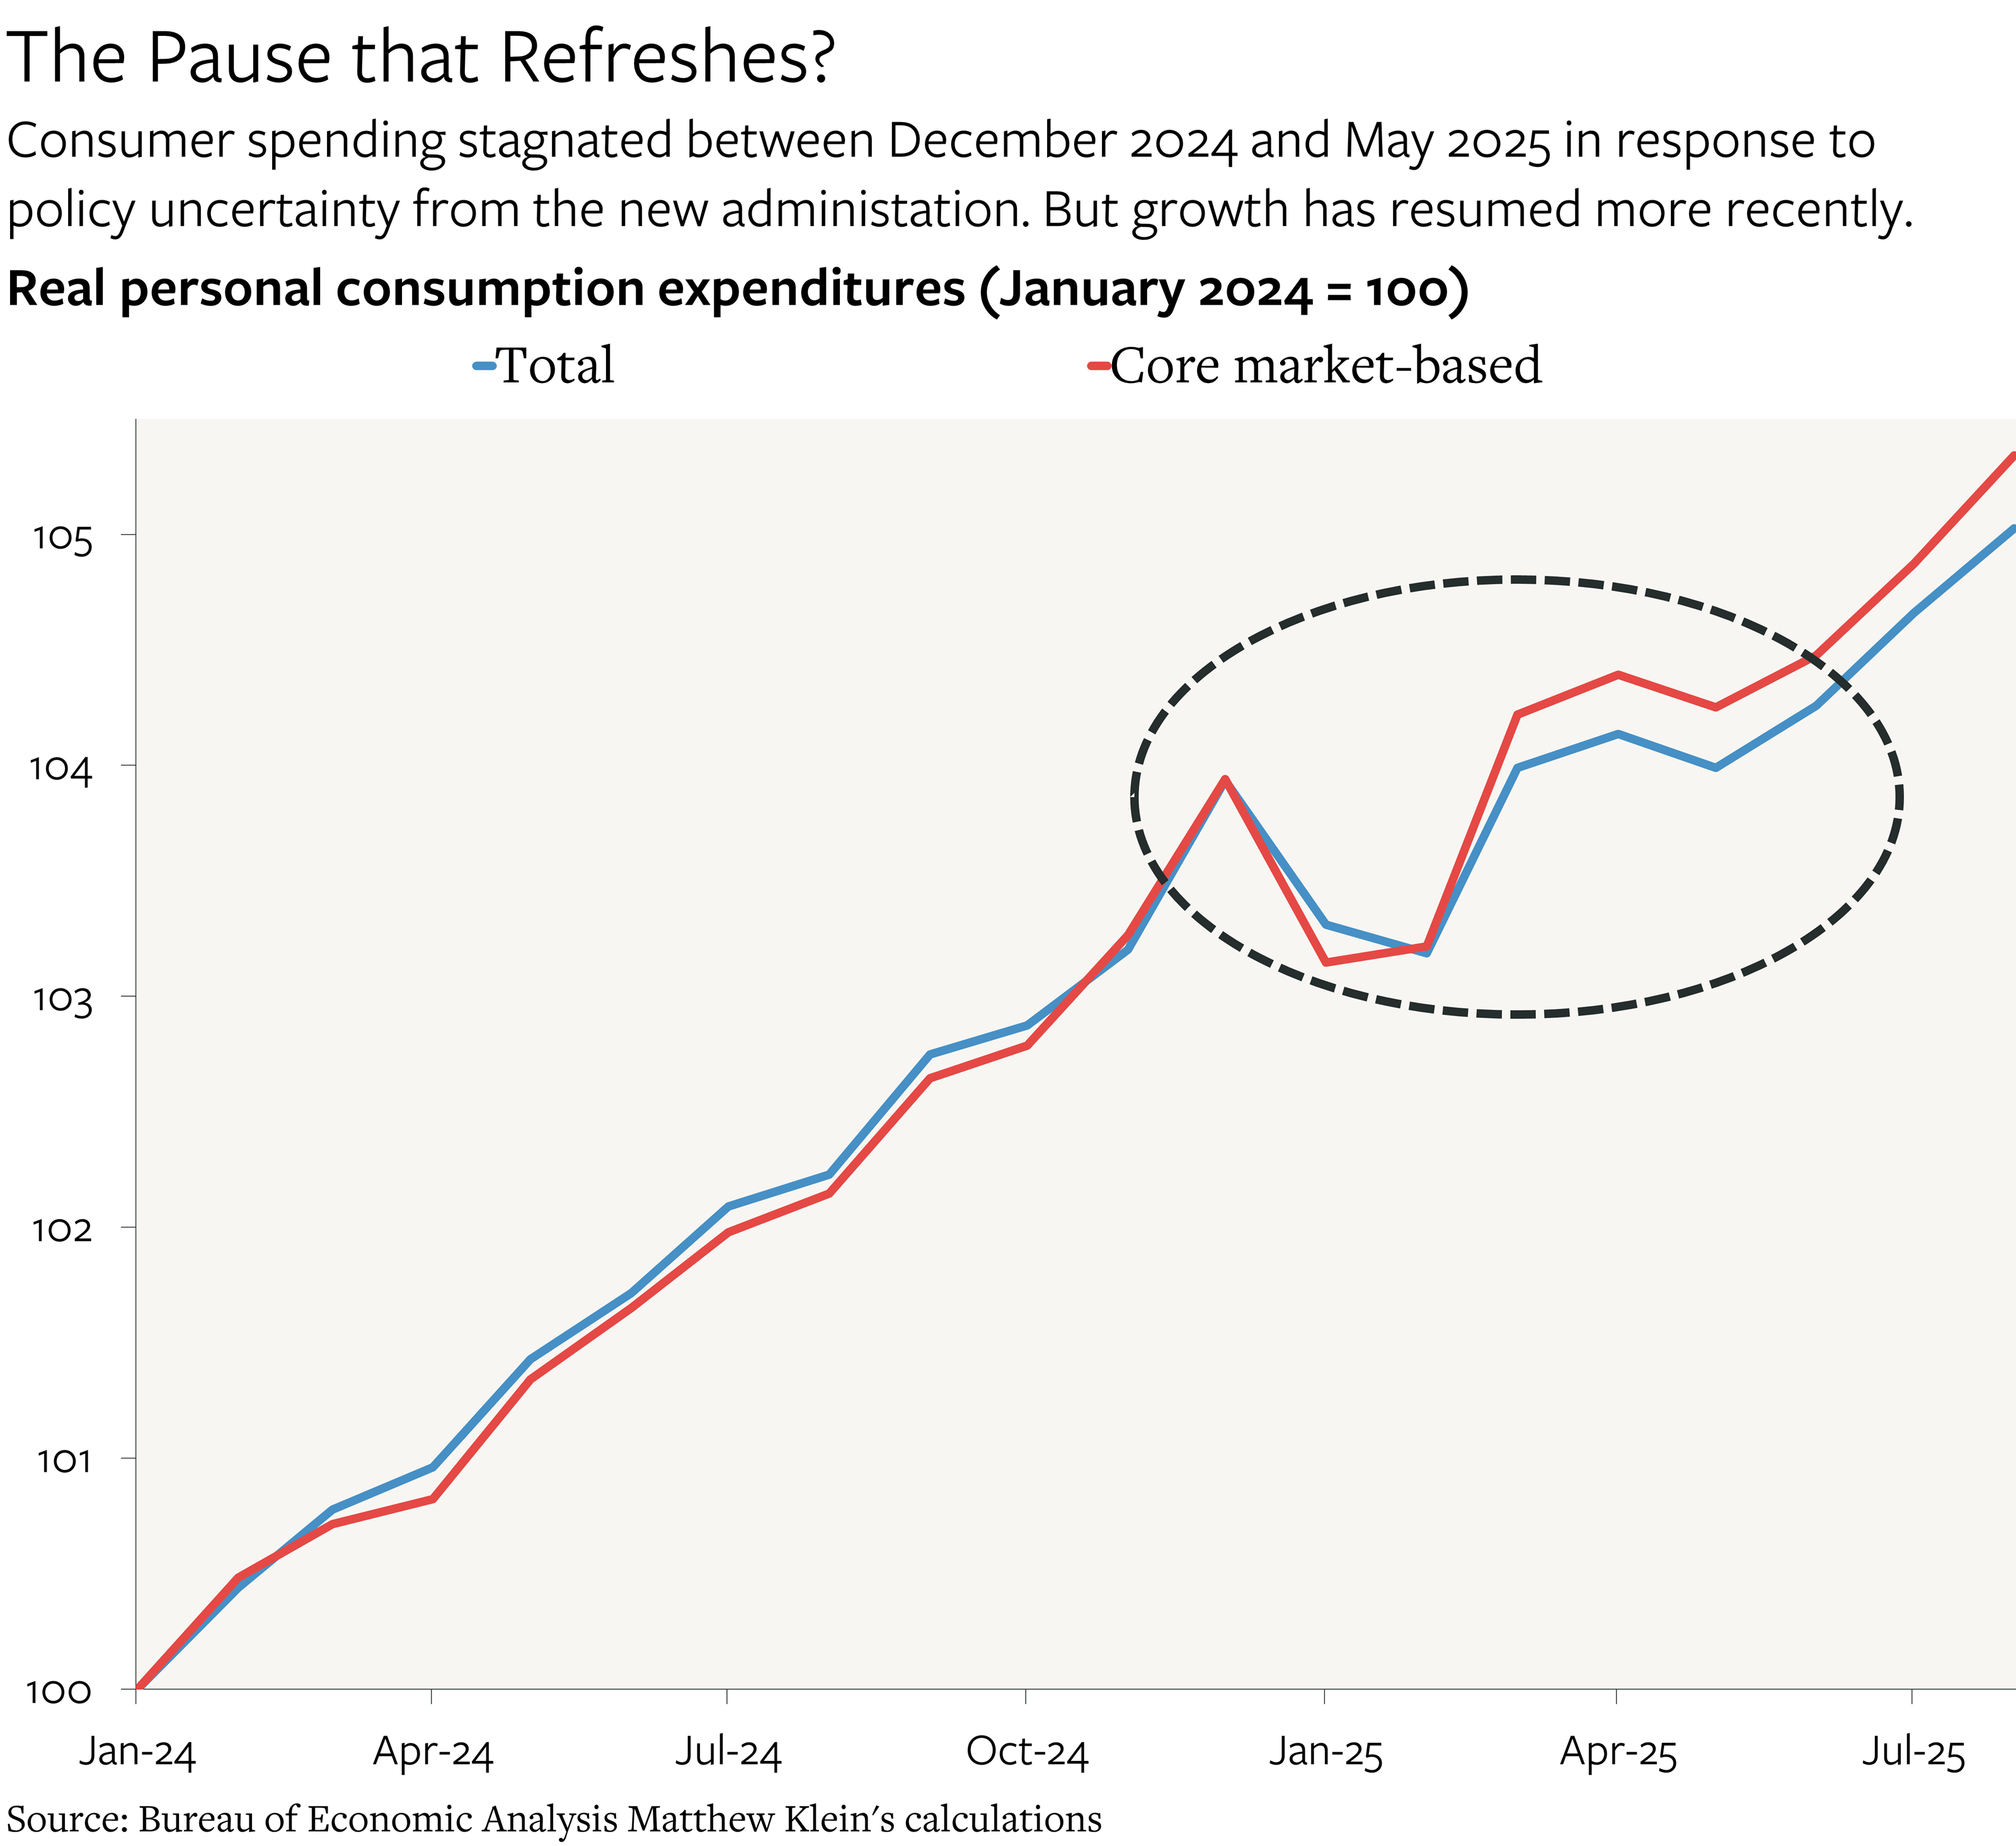
While inflation-adjusted spending on goods and services stagnated from December 2024 through May 2025—likely in response to concerns about tariffs and other policy disruptions—the data have turned around sharply since then. From May through August2, real consumer spending rose at a rate of 4% a year. Excluding components that are unusually volatile or are “other-than-market-based”, real personal consuption expenditures (PCE) rose even faster (4.3% a year). With inflation still coming in relatively strong, overall consumer spending in dollar terms is currently rising at an annualized rate of 7%. Even if that likely includes some make-up purchases to compensate for spending that had been deferred in 2025H1, growth meaningfully re-accelerated over the summer.
One common view is that this growth pop is being powered (supposedly) by a small number of Americans with high incomes and bouyant portfolios, even as most others are (ostensibly) doing badly. To be fair, nominal wage growth for lower-income Americans has been decelerating recently even as the pace of pay gains for higher earners has been picking up, according to both official government data and independent private-sector estimates. Financial asset ownership is also extremely concentrated, with the highest-earning quintile of American households holding about 87% of the stocks, bonds, mutual funds, and ETFs held by households.3
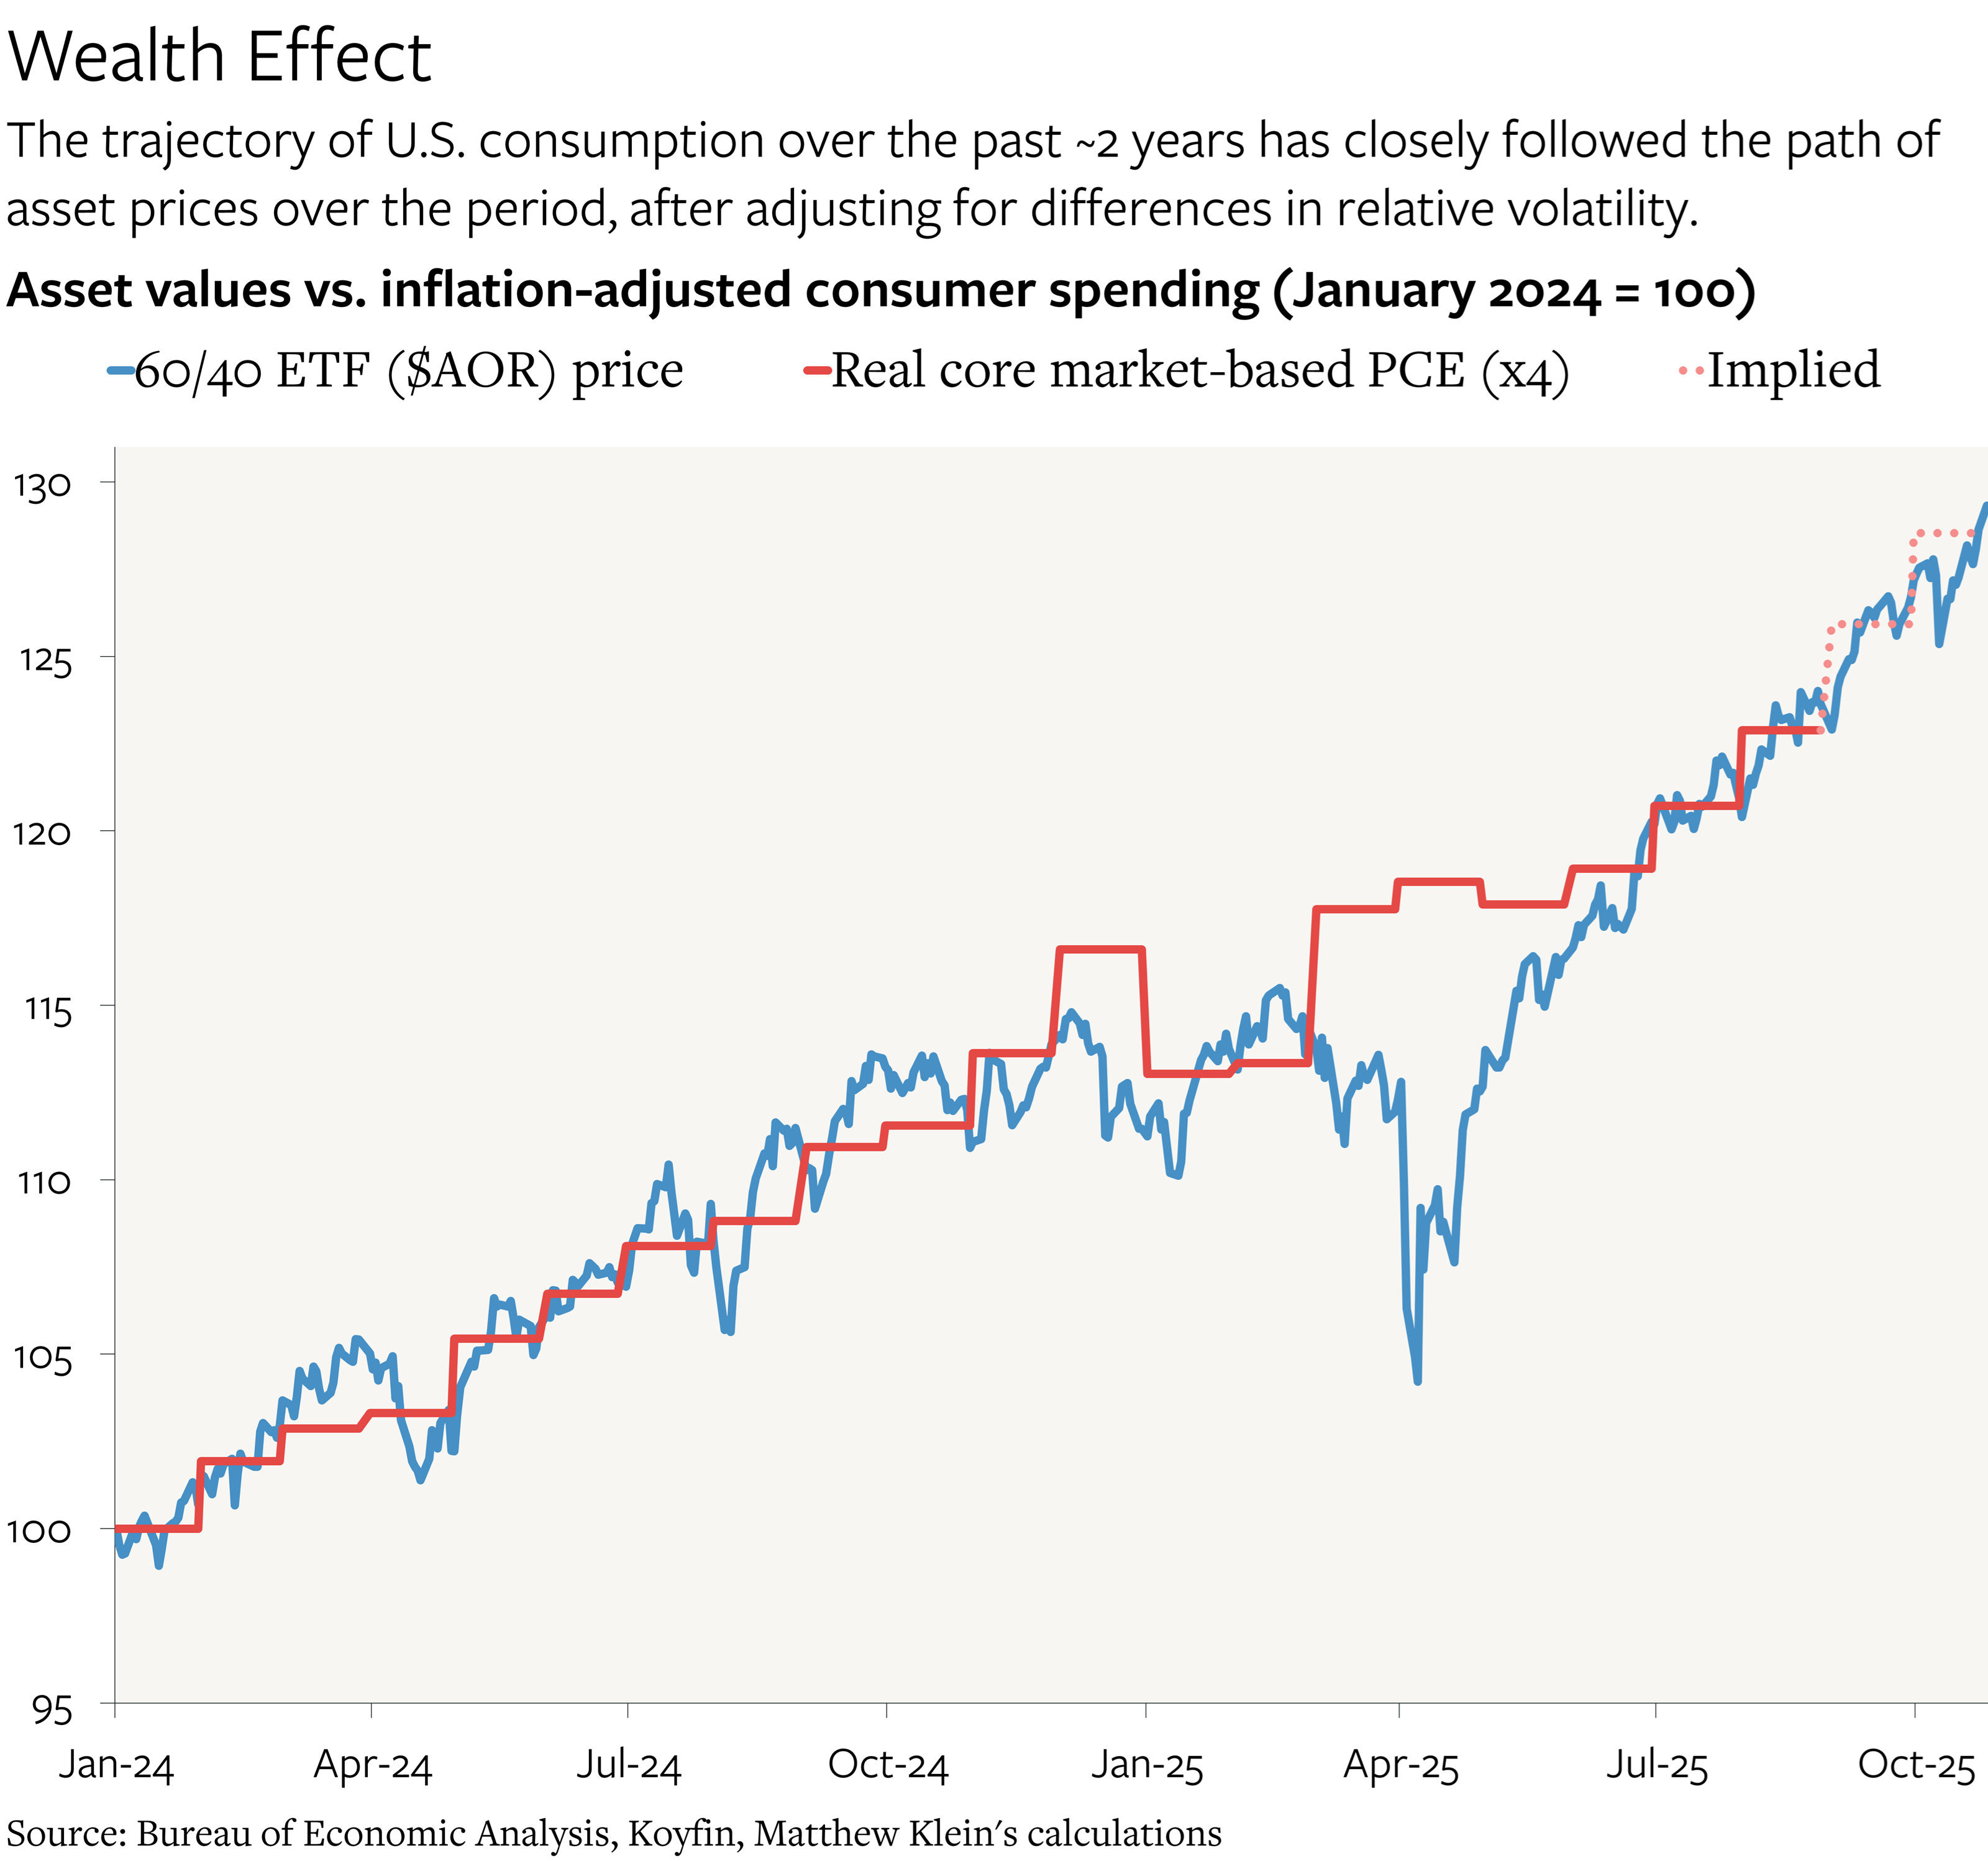
And real consumer spending has more or less tracked asset markets since the beginning of 2024. A typical 60/40 portfolio of global stocks and bonds steadily appreciated by 13% over the course of 2024, was more or less flat from the end of that year until the announcement of “reciprocal” tariffs in early April, fell sharply, and then had rebounded to the prior highs by May. Since then, the typical portfolio has appreciated by another 13% in almost a straight line.
Asset prices have been about 4x as volatile as real PCE over this period, but the direction of travel and the timing of the moves have been broadly aligned with real activity. It is tempting to conclude that there is some causal connection, with rising (or falling) asset prices translating directly into higher (or lower) consumer spending. If the relationship held through the past two months, the implication is that real PCE grew faster than 5% a year (!) in May-October.
All market data in this note come from Koyfin. Subscribers to The Overshoot can get either a free trial or a discounted subscription by using this link.
From this perspective, the aggregate U.S. economy should continue to grow briskly as long as asset prices keep rising—regardless of whether most Americans have actually been participating in either the wealth gains or the consumption boom. Conversely, any slowdown or reversal in asset appreciation, particularly among the big tech companies that have played such an outsized role in the past few years, could potentially shove the whole economy into a downturn as unrealized gains turned into un-monetizable losses.
There are other interpretations. While large swings in the stock market obviously can affect behavior, they also reflect changes in behavior. (A camera, as well as an engine.)
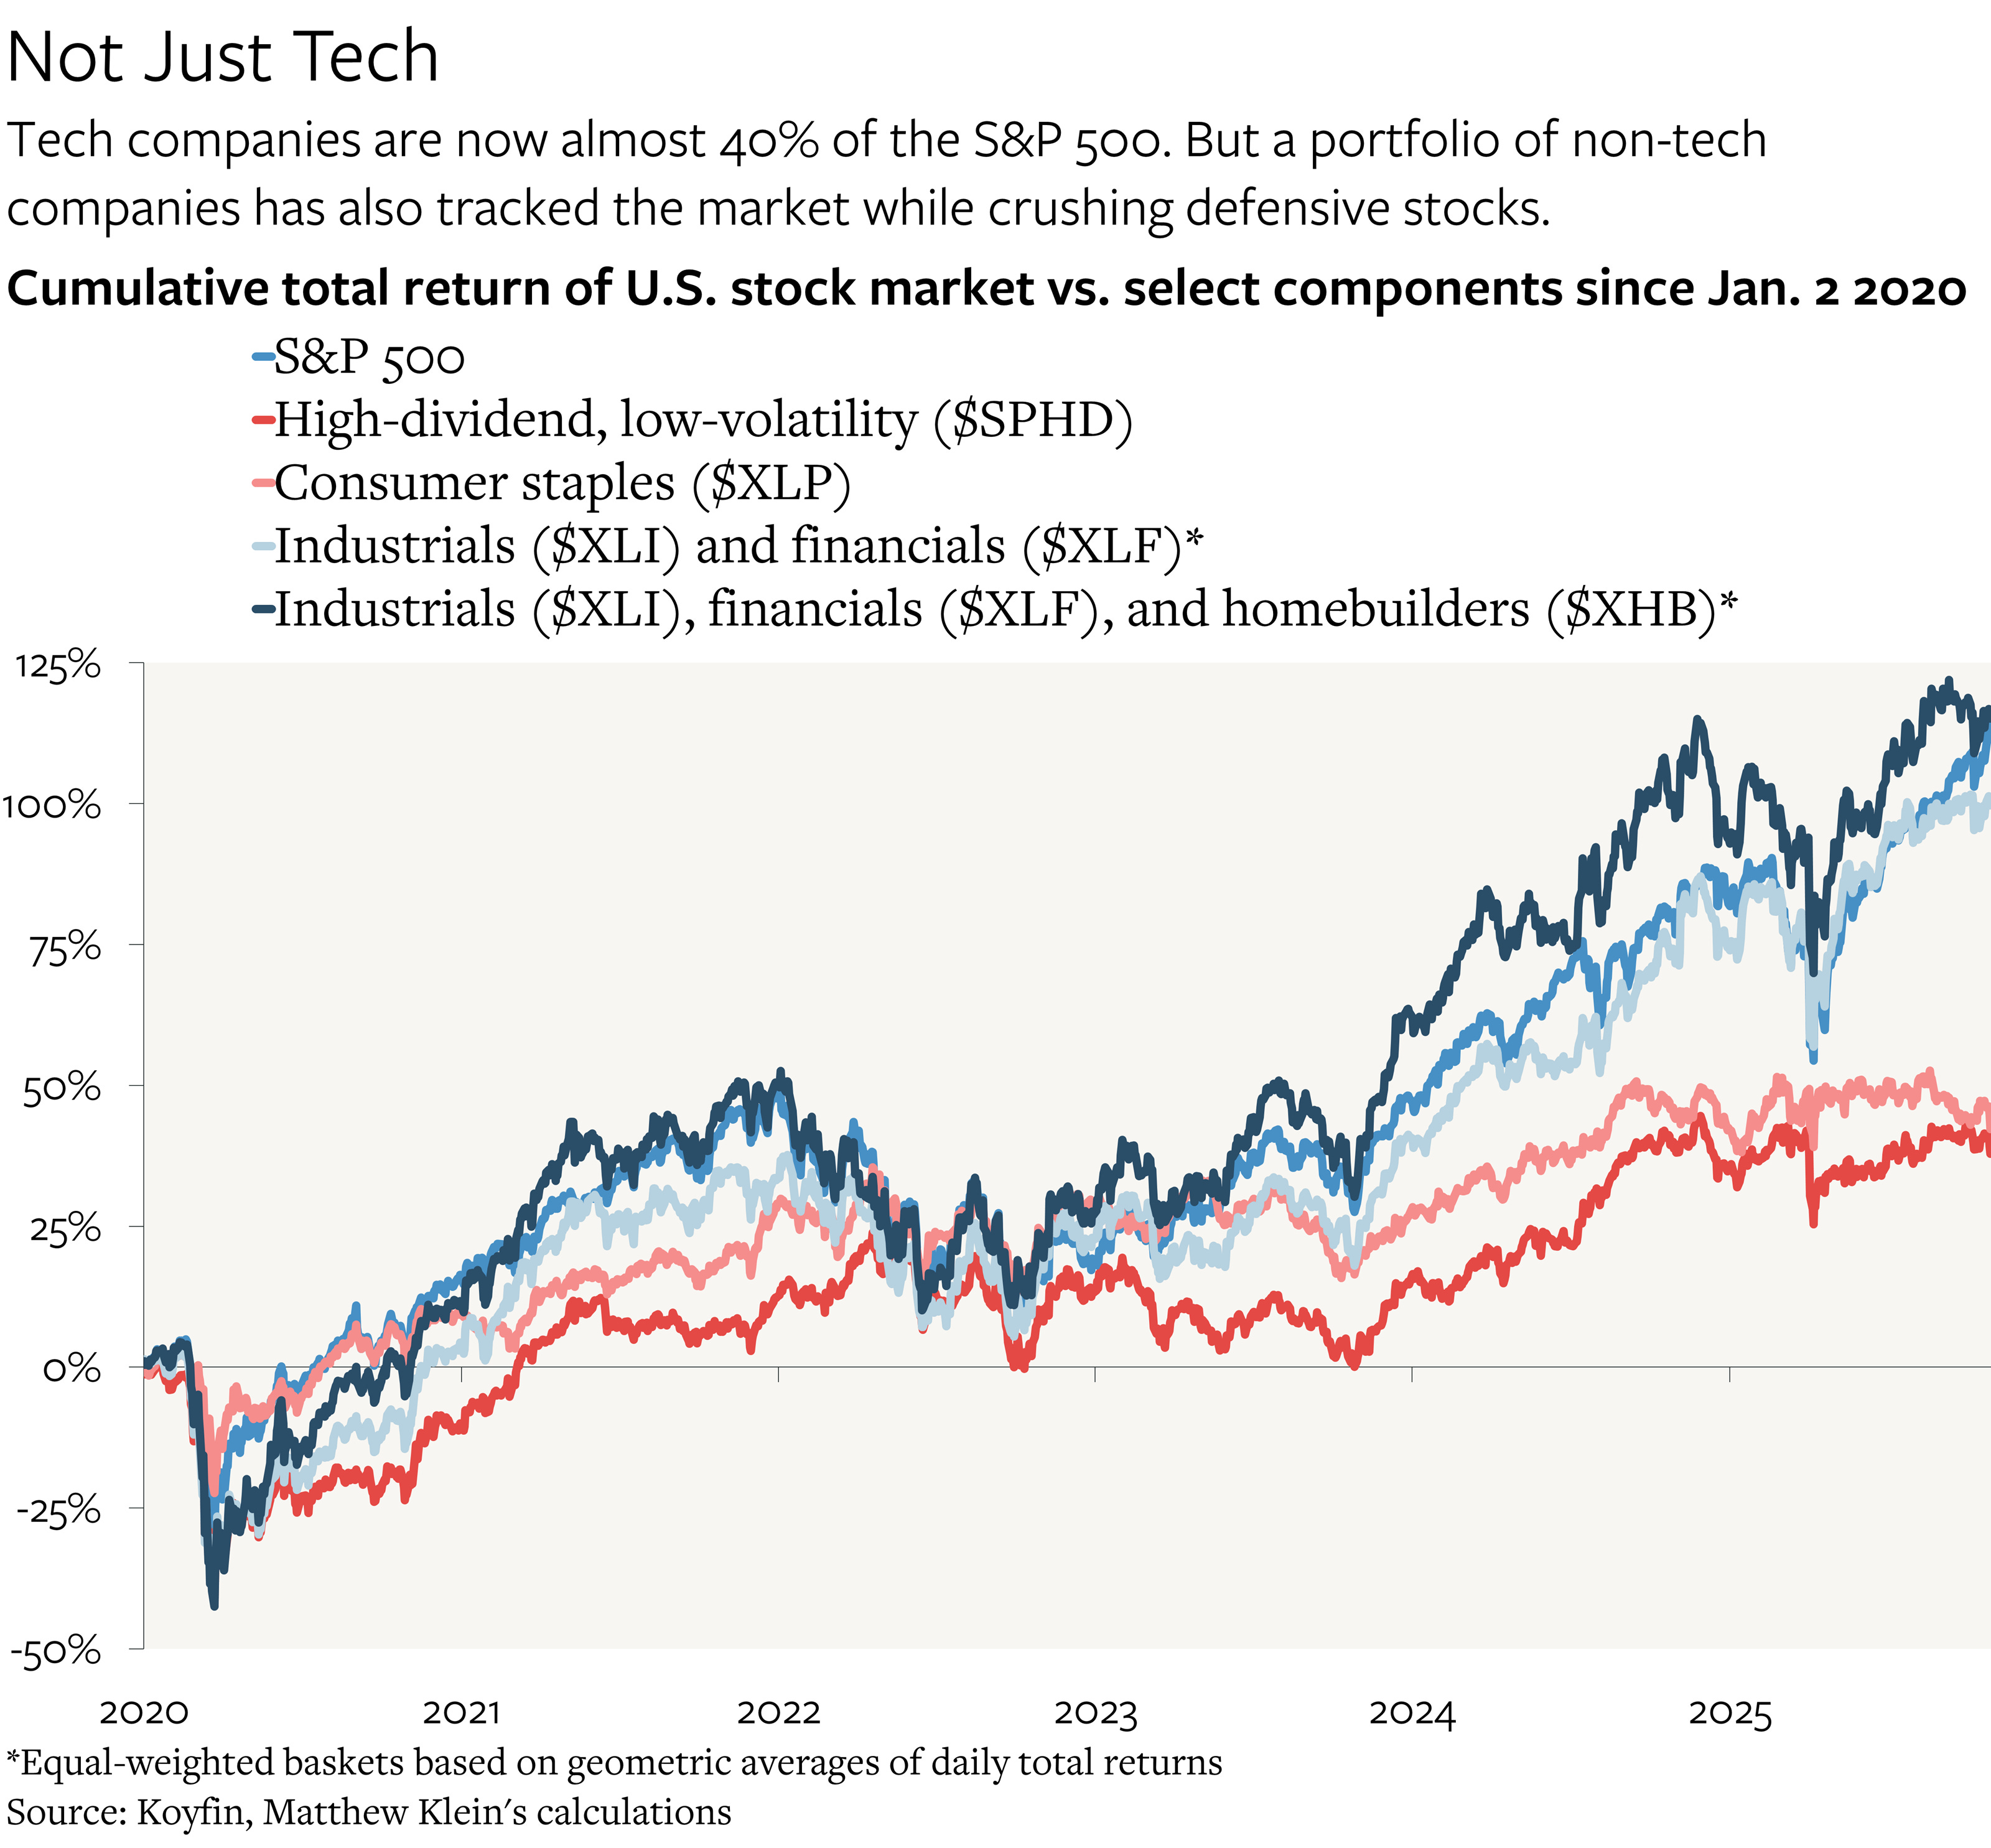
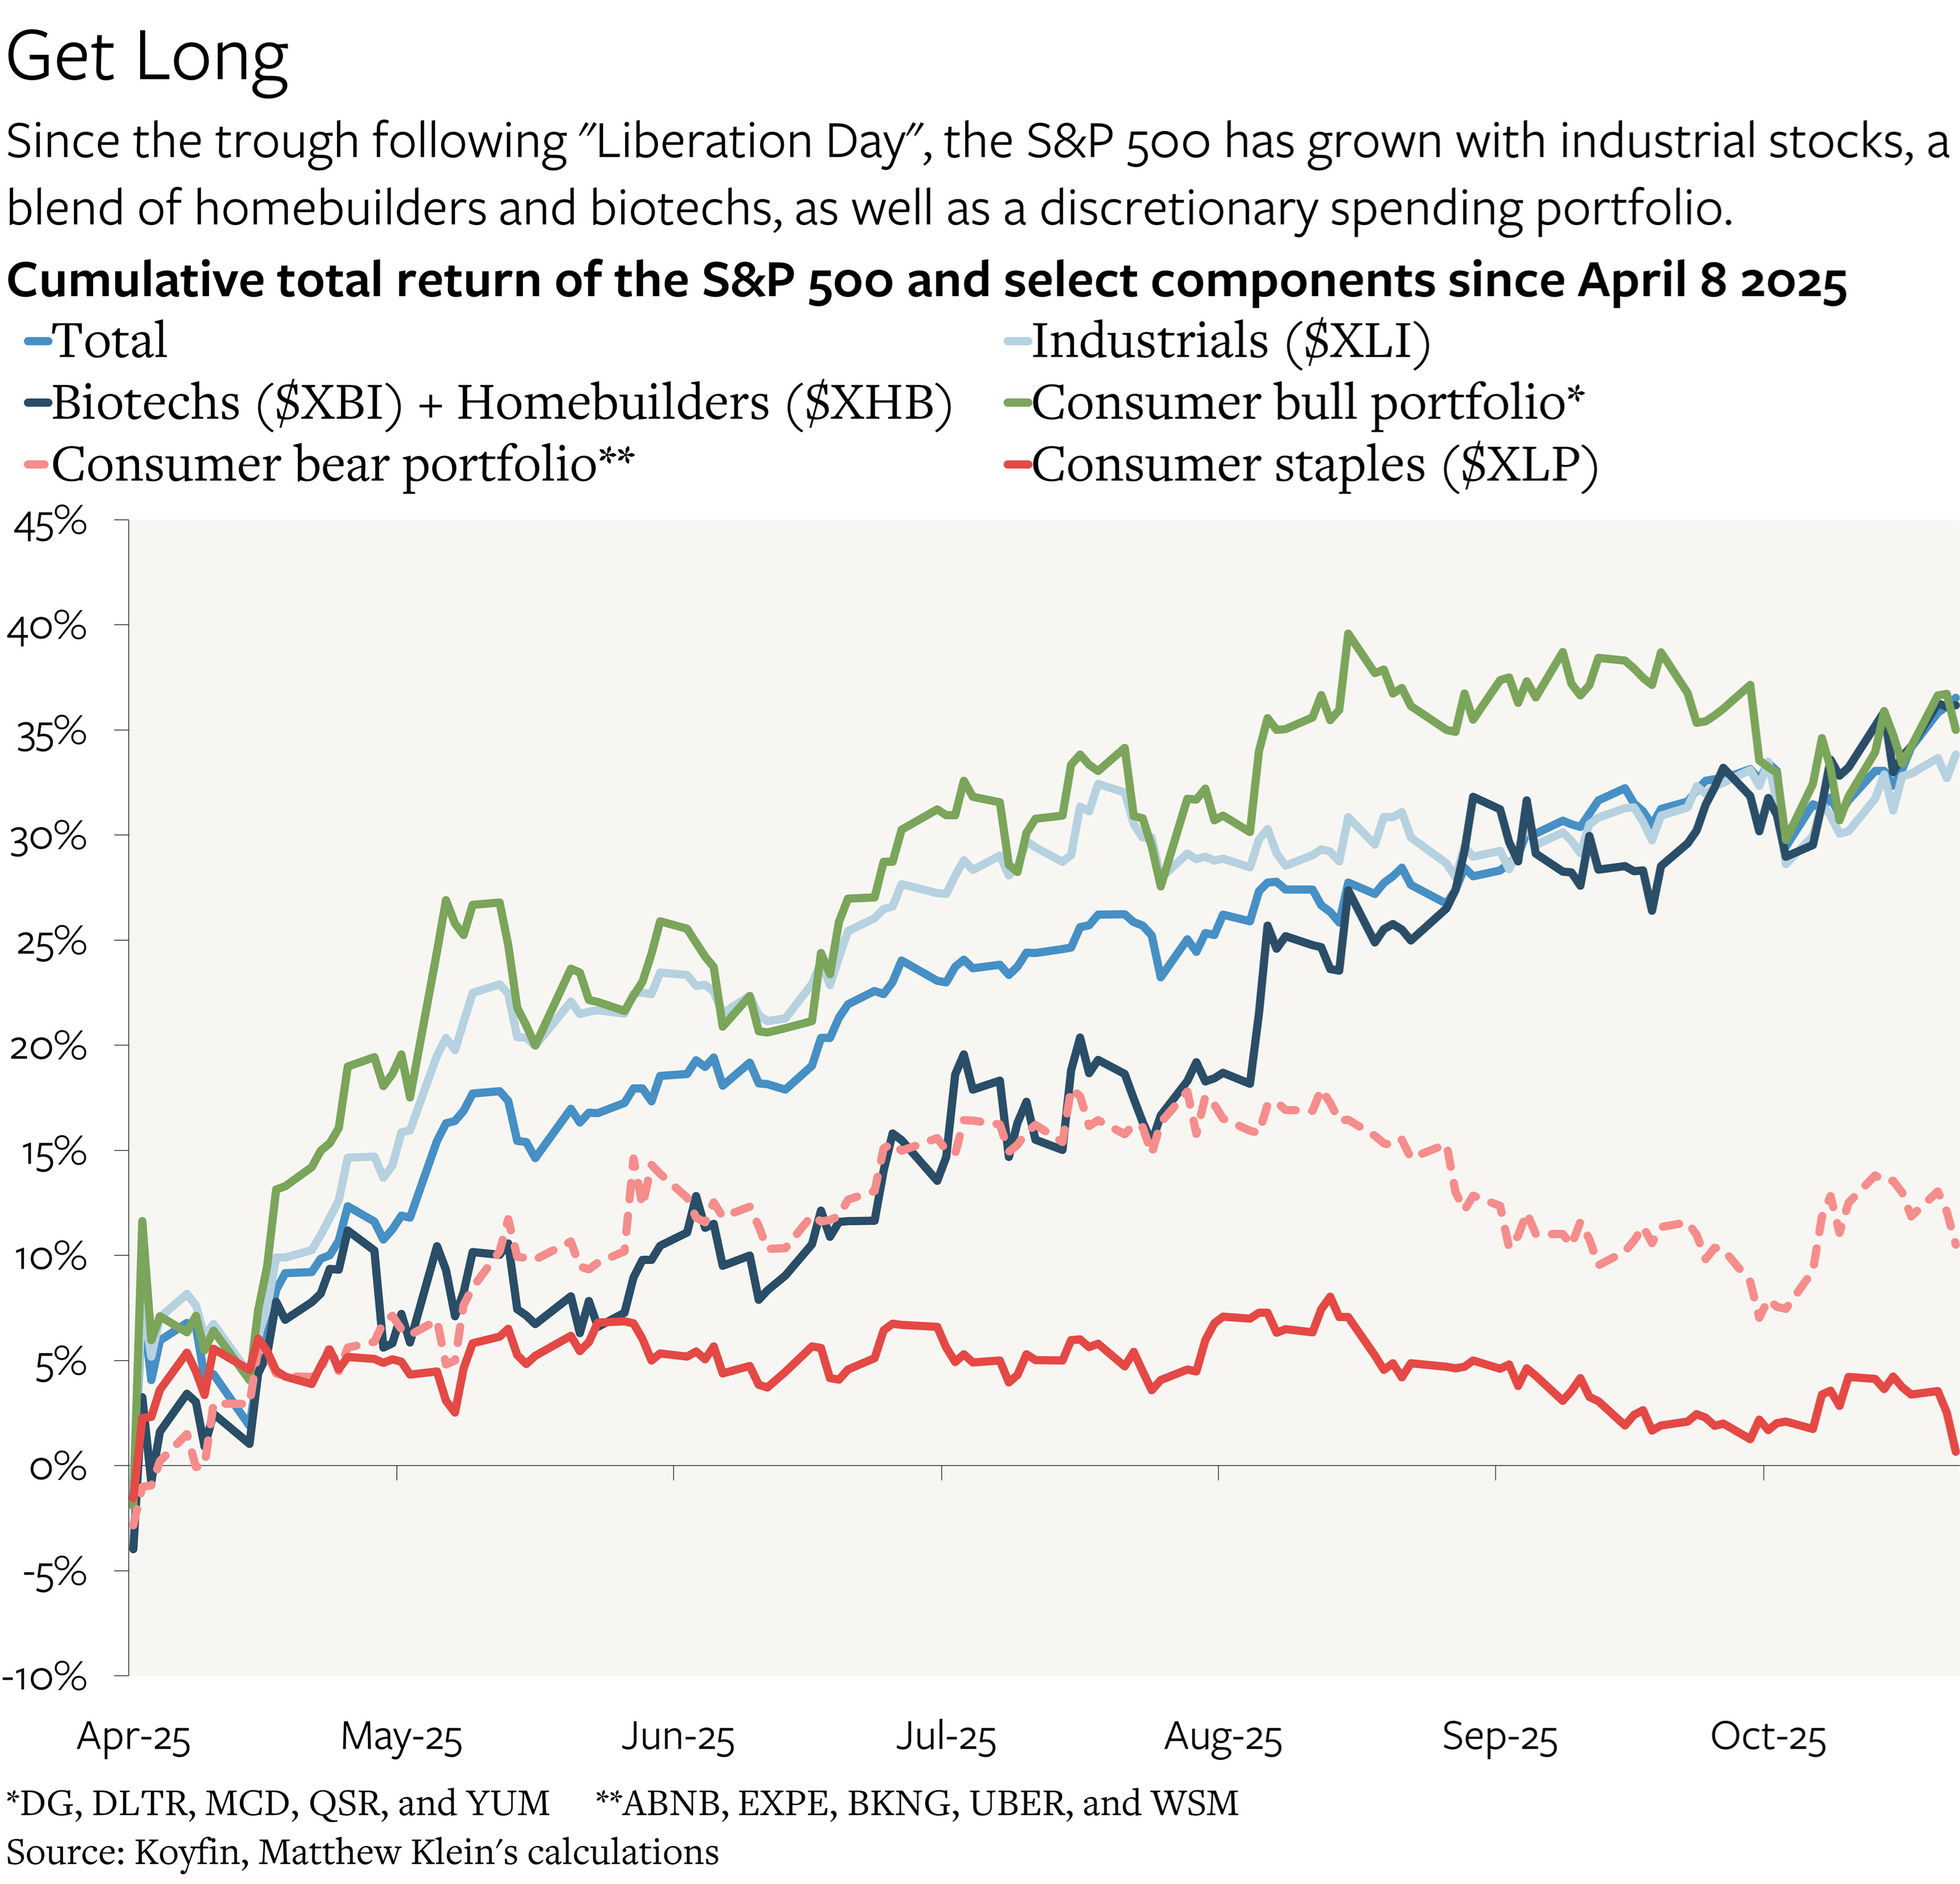
AI-adjacent stocks have obviously been among the strongest performers so far this year—and currently constitute almost 40% of the S&P 500 index by market cap—but they are from carrying the market alone. Industrials and financials have also kept pace with the overall market, while biotech stocks have outperformed so far this year. Even despite some recent losses, homebuilders’ stocks have vastly outperformed the broader market since January 2020 and kept pace with the S&P 500 index since January 2023. By contrast, consumer staples companies and other “defensive” stocks have been among the worst performers so far this year, just as they underperformed the broader market during both the 2021 bull run and during the long expansion following the October 2022 trough.4
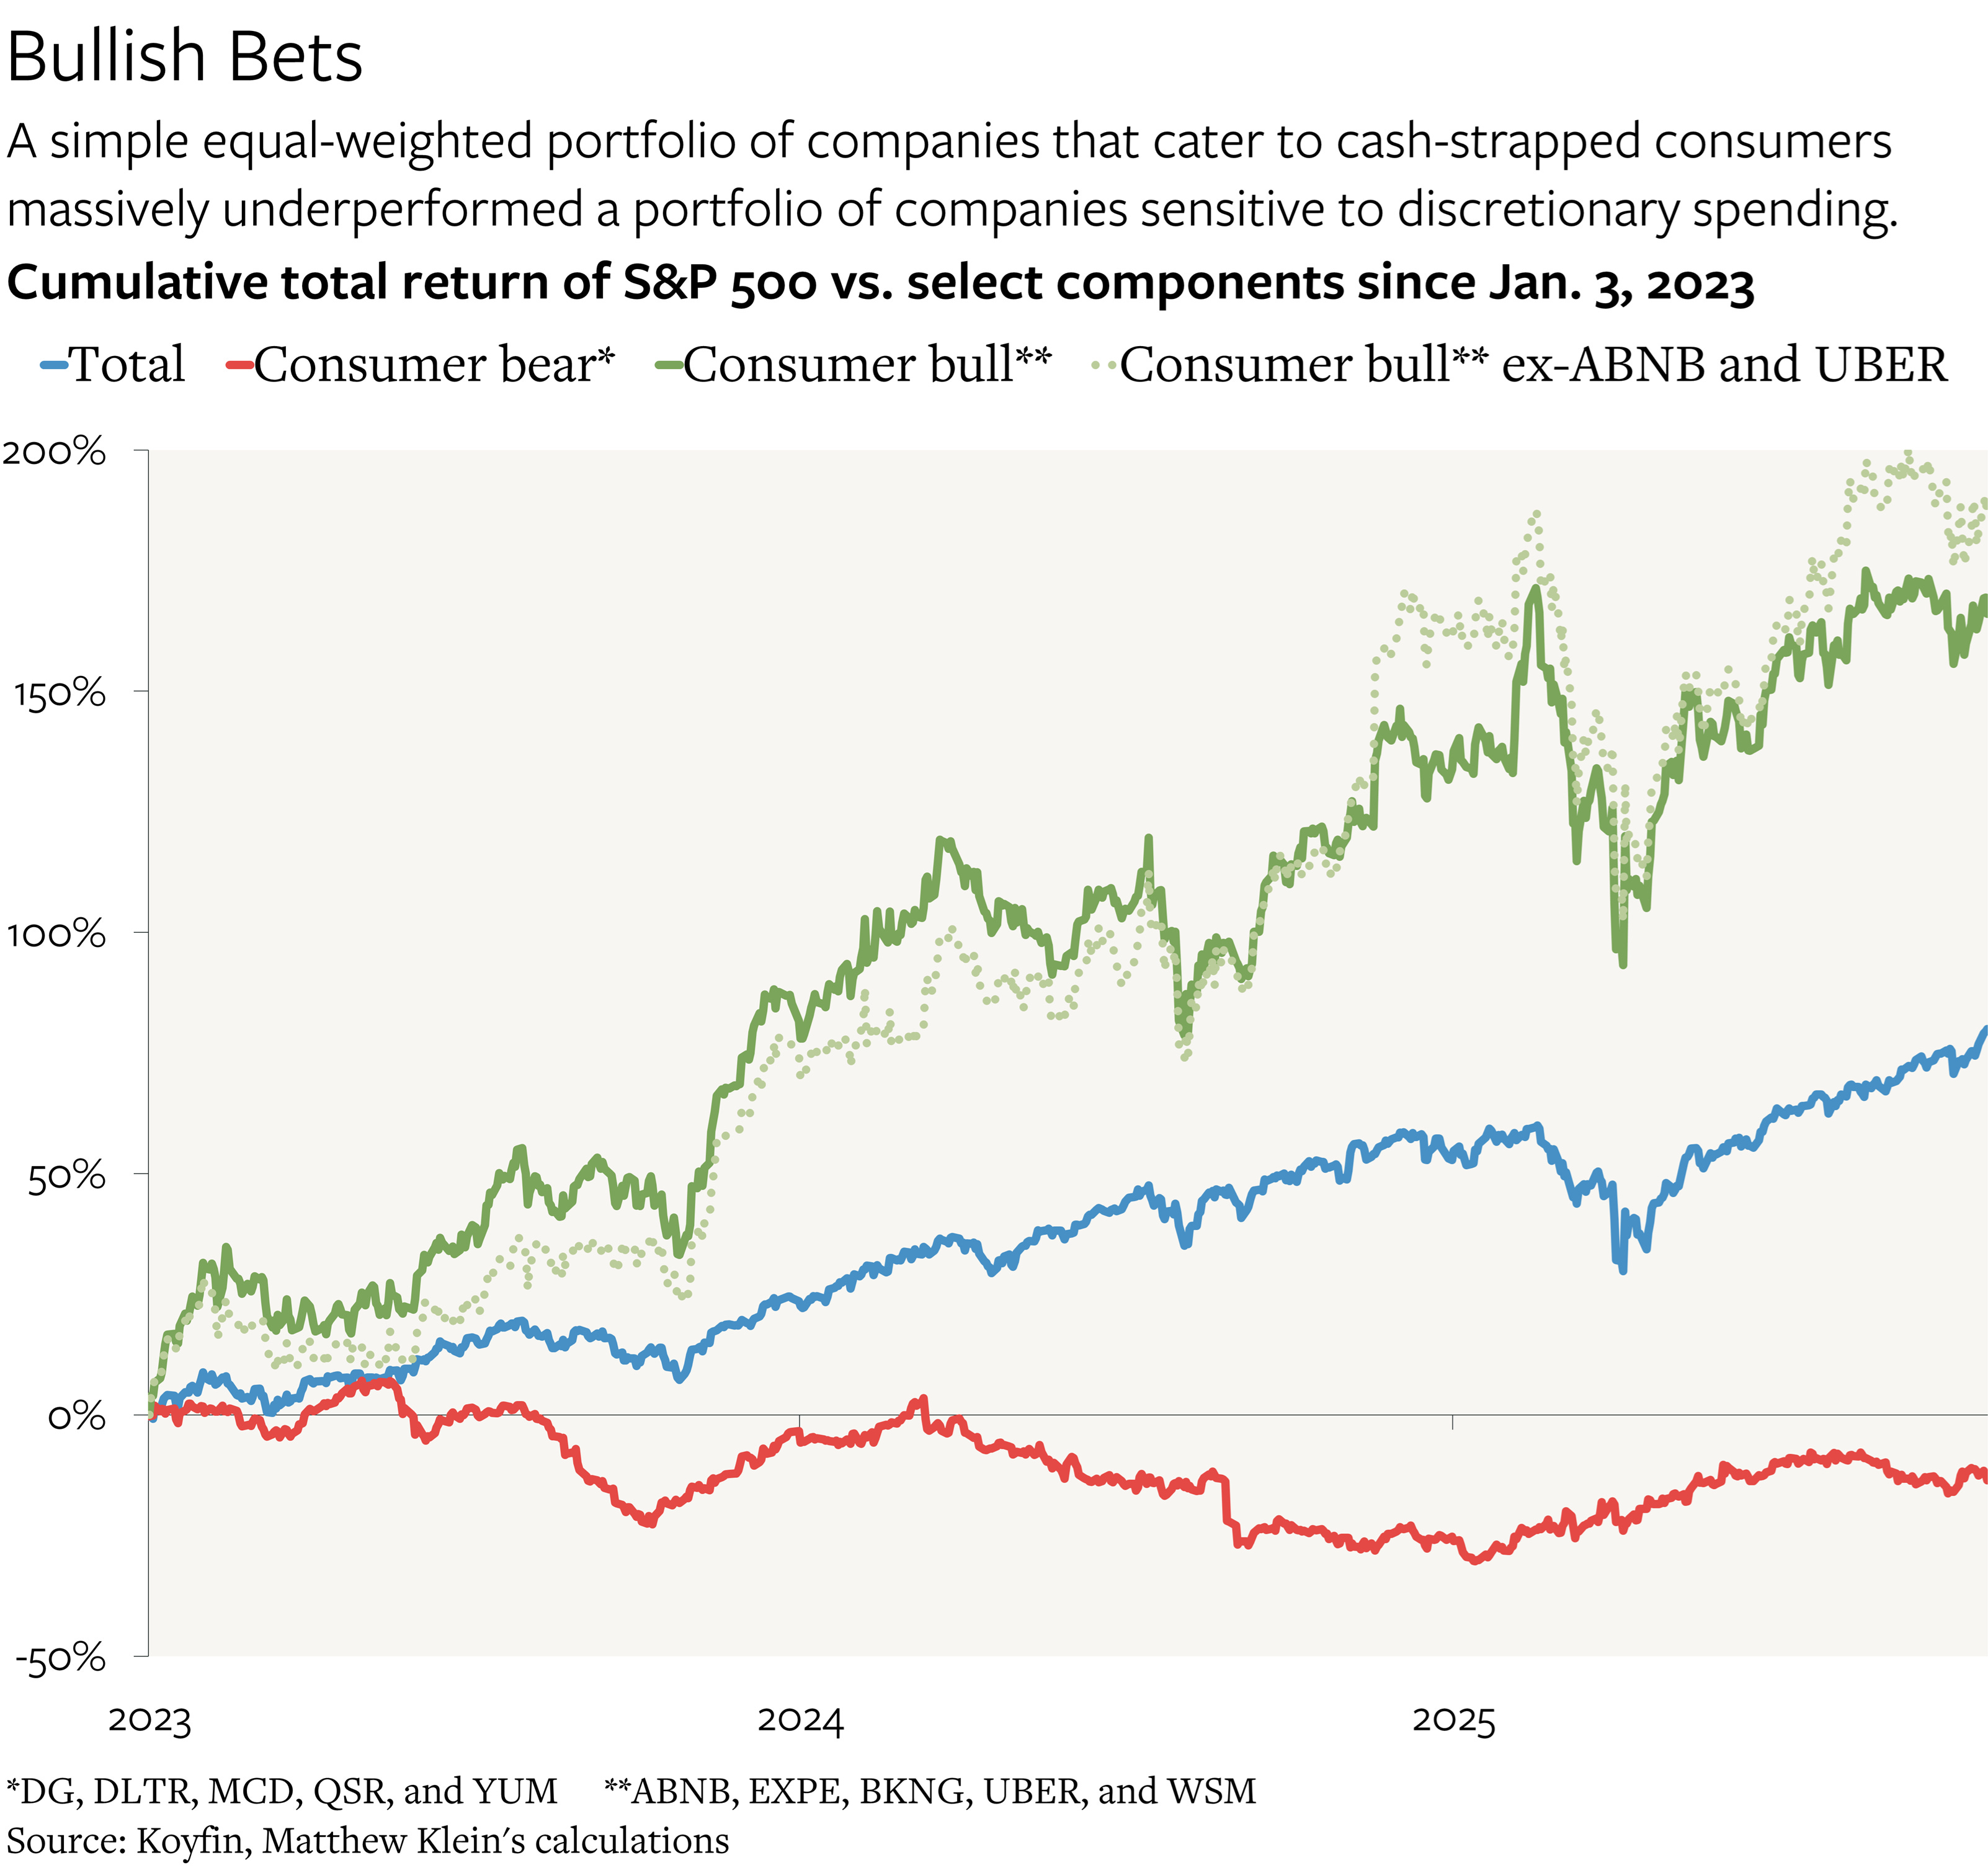
Similarly, a simple equal-weighted portfolio of companies that should do best when consumers are struggling (fast food chains and dollar stores) has been crushed by a portfolio that should be more sensitive to consumers’ willingness to shell out on discretionary purchases (travel/dining companies and furniture retailers). This latter portfolio has also outperformed the broader stock market over the past few years, while matching it over the past few months despite no obvious exposure to the AI growth story. Reasonable people can disagree with the specific securities selected, but the picture is consistent with the sectoral returns.5
These relative performance patterns are also evident in the recovery from the trough following “liberation day”, which may have some signal value for interpreting the drivers of the recovery in real consumer spending over the same period. Rightly or wrongly, investors have been betting that broad swathes of the U.S. economy are doing well—as well as betting on the thesis that American consumers have spending power they are willing to use.
The stock market returns are suggestive, but they are not conclusive. Fortunately, they are consistent with the information available from official government sources on household balance sheets, income, and spending.
Debt Free, Cash Rich, Can’t Lose
From the end of WWII until the 2008 financial crisis, policymakers in the U.S. responded to downturns (mostly) by lowering interest rates to encourage consumers and businesses to save less, borrow more, and spend. That became increasingly untenable as private indebtedness kept rising and as rates continued to drift towards zero. The strategy reached its limit in the 2000s, when, in the memorable words of Paul Krugman paraphrasing Paul McCulley, “Alan Greenspan [created] a housing bubble to replace the Nasdaq bubble”.
The problem was that borrowing against assets that do not generate income—to finance consumption that does not increase debt-servicing capacity—is inherently unsustainable. Ultimately, the excess debt has to be dealt with one way or another, either by forcing borrowers to spend less so that they can repay what they owe, restructured/inflated away at the expense of creditors, or some combination.6 The U.S. and other rich countries avoided massive debt writedowns, inflation, and currency debasement, but still paid the price for past excesses with a permanently lower growth trajectory. It was better than the Great Depression, but not by much. By the eve of the pandemic, Americans (and Europeans) were trillions of dollars poorer than they should have been. And it also seemed as if the “new normal” since 2008 would put a ceiling on interest rates around 1.5-2%.
The pandemic—and in particular the economic policy response—changed everything, at least in the U.S.
In the 1940s, mobilization and wartime rationing created a surge in spending that wiped out private indebtedness and laid the groundwork for the long debt boom that followed. In the 2020s, unprecedented government income support, forced saving, and huge swings in demand for specific goods and services had a similar effect, albeit on a smaller scale: the trend growth rates of both nominal wages and inflation seem to have persistently accelerated and, particularly relevant for us, household balance sheets were cleaned up. The Federal Reserve’s distributional financial accounts (DFAs) show how the benefits were (likely) shared across a broad swathe of income and wealth cohorts.